Question
Question: P-V plots for two gases adiabatically are shown in the figure. Plots 1 and 2 should correspond respe...
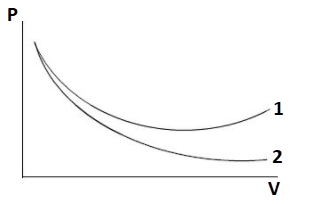
P-V plots for two gases adiabatically are shown in the figure. Plots 1 and 2 should correspond respectively:
A) He and O2
B) O2 and He
C) He and Ar
D) O2 and N2
Solution
Notice the given P−Vplot. Two curves are being plotted. The slope is high for the first curve as compared to the second curve. There are four gases i.e. O2, He, Ar and N2. Distinguish the monoatomic, diatomic and triatomic gases from these four. Apply the relation for adiabatic change i.e., PVγ=constant and differentiate the relation. After rearranging the terms, a relation between the slope and specific heat can be obtained. After that relate it with each option given in the question.
Complete solution:
Out of O2, He, Ar and N2, only O2 and N2 are diatomic gases while He and Ar are monatomic gases.
For diatomic gases, the ratio of specific heats is 1.4
For monoatomic gases, the ratio of specific heats is 1.67
For adiabatic change, PVγ=constant
Taking derivative, we get
⇒dpVγ+γPVγ−1dV=0
On rearranging terms, we get
Thus, from the above relation we can conclude that slope of the curve varies as per γ.
It is clear from the given plot that slope of curve 2 is greater than that of curve 1.
∴γ2>γ1
Curve 1 should be for diatomic gases like O2 and N2
Curve 2 should be for monoatomic gases like He and Ar
Thus, curve 1 and curve 2 corresponds to O2 and He, respectively.
Therefore, option (B) is the correct choice.
Note: In the first option, He and O2 gases are given. He is monoatomic gas while O2 is diatomic gas. In the second option, O2 and He gases are given. So, the point is He will remain monoatomic gas while O2 will remain diatomic gas but in first option for curve 1, He is given and for curve 2, O2 is given. Although the options are the same but the first gas is given for curve 1 and the second gas is for curve 2.