Question
Question: P-V diagram of an ideal gas is shown in figure. Work done by the gas in the process ABCD is- 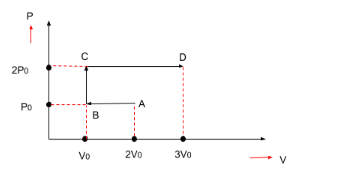
A.)2P0V0
B.)3P0V0
C.)P0V0
D.)4P0V0
Solution
Hint: We will find out the work done from point A to point B. from point B to point C, from point C to point D respectively. Then we will add the values of each work done in order to find out the total work done. Refer to the solution below.
Formula used: WAB=P×ΔV=area
Complete answer:
As we know that the work done for the P-V curve is the area under the P-V curve.
First, we will find out the work done from point A to point B.
⇒WAB=P×ΔV=area (as shown in the figure)
Pressure = P0
Volume-
Initial volume is 2V0
Final volume is V0
⇒V0−2V0=−V0
Substituting these values in the formula for work done-
⇒WAB=P×ΔV ⇒WAB=−P0(V0) ⇒WAB=−P0V0
Now, we will find out the work done from point B to point C.
⇒WBC=P×ΔV=area (as shown in the figure)
Volume in this case will be as zero as can be seen from the figure. Hence, the work done will also be zero.
⇒WBC=0
Now, we will find out the work done from point C to point D.
⇒WCD=P×ΔV=area (as shown in the figure)
Pressure = 2P0
Volume-
Initial volume is V0
Final volume is 3V0
⇒3V0−V0=2V0
Substituting these values in the formula for work done-
⇒WAB=P×ΔV ⇒WAB=2P0(2V0) ⇒WAB=4P0V0
Now, work done in total will be the sum of all the above values-
⇒WT=−P0V0+0+4P0V0 ⇒WT=3P0V0
Hence, it is clear that option B is the correct option.
Note: Gas can work against excessive ambient pressure by extending or compressing it. Work done is often referred to as the amount of pressure-volume or PV. The volume of a gas increases