Question
Question: One hundred management students who read at least one of the three business magazines are surveyed t...
One hundred management students who read at least one of the three business magazines are surveyed to study the relationship pattern. It is found that 80 read Business India, 50 read Business World, and 30 read Business Today. Five students read all the magazines. How many read exactly two magazines?
A) 50
B) 10
C) 95
D) 25
Solution
It is given in the question that One hundred management students who read at least one of the three business magazines are surveyed to study the relationship pattern. It is found that 80 read Business India, 50 read Business World, and 30 read Business Today. Five students read all the magazines. We are asked to find the number of students who read exactly two magazines out of the given magazines.
This question is solved by using the Venn Diagram.
Venn Diagram: Venn diagram is also called Primary diagram, Set Diagram or Logic Diagram, is a diagram that shows all possible logical relations between a finite collection of different sets.
Complete step by step solution:
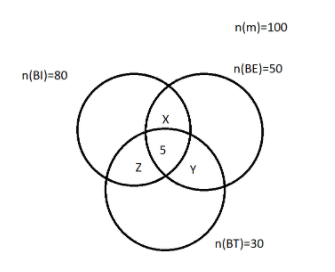
Let, M denote all the three magazines, BI denote magazine named Business India, BW denotes magazine named Business World, BT denotes magazine named Business Today
n(M)=100
n(BI)=80 n(BW)=50 n(BT)=30
From the figure, we get
n(M)=n(BI)+n(BW)+n(BT)−(x+5)−(y+5)−(z+5)+5
100=80+50+30−(x+5)−(y+5)−(z+5)+5
Make x+y+z as a subject,
x+y+z=80+50+30+5−15−100
⇒x+y+z=50
Hence, number of persons who read exactly two magazines = 50 persons.
Note:
A Venn diagram consists of multiple overlapping closed curves, usually circles, each representing a set. The point inside a curve labelled as S represents elements of the set S, while the point outside the boundary represents elements that are not in the set S.