Question
Question: On the same graph paper, plot the graph of \[y=2x-1\], \[y=2x\] and \[y=2x+1\] from \[x=-2\] to \[x=...
On the same graph paper, plot the graph of y=2x−1, y=2x and y=2x+1 from x=−2 to x=4. Are the graph (line) drawn parallel to each other? If yes enter 0 otherwise 1.
Solution
We are given a question to plot the graph of the given equations. We will first find the points which lie on the line for each of the equations given to us. The values of ‘x’ to be taken as per the question are from x=−2 to x=4. So, we will put the values of all the values of ‘x’ from the given interval as the x – coordinate of the point and find the value of the respective y – coordinate of the point. Therefore, we will have the required points and we will plot the graphs. Then we will have the clear picture if the lines are parallel to each other or not. Hence, we will have the required values.
Complete step by step solution:
According to the given question, we are given three equations which we are asked to plot on the graph paper.
The equations that we have are,
y=2x−1, y=2x and y=2x+1
In order to plot the graph of the given equations, we have to first find the points on the line of each of the equations.
The first equation that we have is,
- y=2x−1
We are given that values of ‘x’ ranges from x=−2 to x=4, so we have,
For x=−2, we have,
y=2(−2)−1=−4−1=−5
The point is (−2,−5).
For x=−1, we have,
y=2(−1)−1=−2−1=−3
The point we get is (−1,−3).
For x=0, we have,
y=2(0)−1=−1
The point is (0,−1).
For x=2, we have,
y=2(2)−1=4−1=3
The point is (2,3).
For x=4, we have,
y=2(4)−1=8−1=7
The point is (4,7).
Next, we have the equation, - y=2x
We are given that values of ‘x’ ranges from x=−2 to x=4, so we have,
For x=−2, we have,
y=2(−2)=−4
The point is (−2,−4).
For x=−1, we have,
y=2(−1)=−2
The point we get is (−1,−2).
For x=0, we have,
y=2(0)=0
The point is (0,0).
For x=2, we have,
y=2(2)=4
The point is (2,4).
For x=4, we have,
y=2(4)=8
The point is (4,8).
Next, we have the third equation given to us, which is, - y=2x+1
We are given that values of ‘x’ ranges from x=−2 to x=4, so we have,
For x=−2, we have,
y=2(−2)+1=−4+1=−3
The point is (−2,−3).
For x=−1, we have,
y=2(−1)+1=−2+1=−1
The point we get is (−1,−1).
For x=0, we have,
y=2(0)+1=1
The point is (0,1).
For x=2, we have,
y=2(2)+1=4+1=5
The point is (2,5).
For x=4, we have,
y=2(4)+1=8+1=9
The point is (4,9).
Based on the point that we have obtained, the graph we have is,
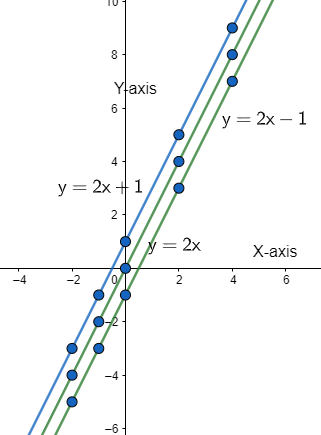
Therefore, we can see that the lines are parallel to each other so our answer is 0.
Note: The points of the graph should be carefully found and also step wise so as to prevent any mistakes creeping in. Also while plotting the points on the graph take an appropriate scale so that the lines can be easily compared and worked further.