Question
Question: On acceleration time graph, a horizontal line indicates:...
On acceleration time graph, a horizontal line indicates:
Solution
The same way as velocity vs time graphs tell us about an object's displacement, acceleration vs time graphs inform us about its velocity. The area under the graph for a specific time interval is equal to the change in velocity during the same time interval.
Complete step by step answer:
The acceleration vs. time graph will show a straight horizontal line at y=0. Because acceleration is the derivative of velocity, the slope of the curves on a velocity vs. time graph can be used to predict what an acceleration vs. time graph for an object's motion would look like (much as the slopes of the curves on a position vs. time graph can be used to predict what a v vs t graph will look like, because velocity is the first derivative of position).
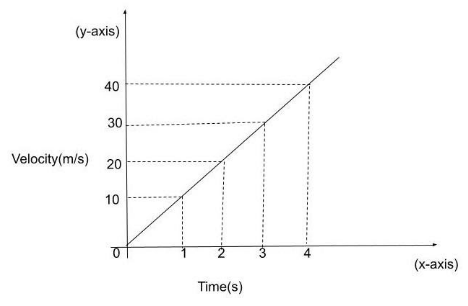
The independent variable on a graph of velocity vs time is time, which is depicted on the x-axis. On the y-axis, velocity is plotted, and the graph depicts how velocity varies over time.A horizontal line on the graph depicts a velocity that is constant through time (e.g., no acceleration). It would apply to an object moving at a constant speed in a vacuum with no external forces acting on it.
If the v vs t graph's lines are straight and horizontal, indicating that the item is moving at a constant velocity, the slopes of those lines are 0 , and the a vs t graph should show a straight, horizontal line at y=0 (along the z-axis).
Note: If your acceleration is positive at one point, your velocity will increase at that point. If you have a negative acceleration, your velocity will decrease. Finally, if your acceleration is zero, your velocity will remain constant and will not change.