Question
Question: The voltage across a pure inductor is represented in figure. Which one of the following curves in th...
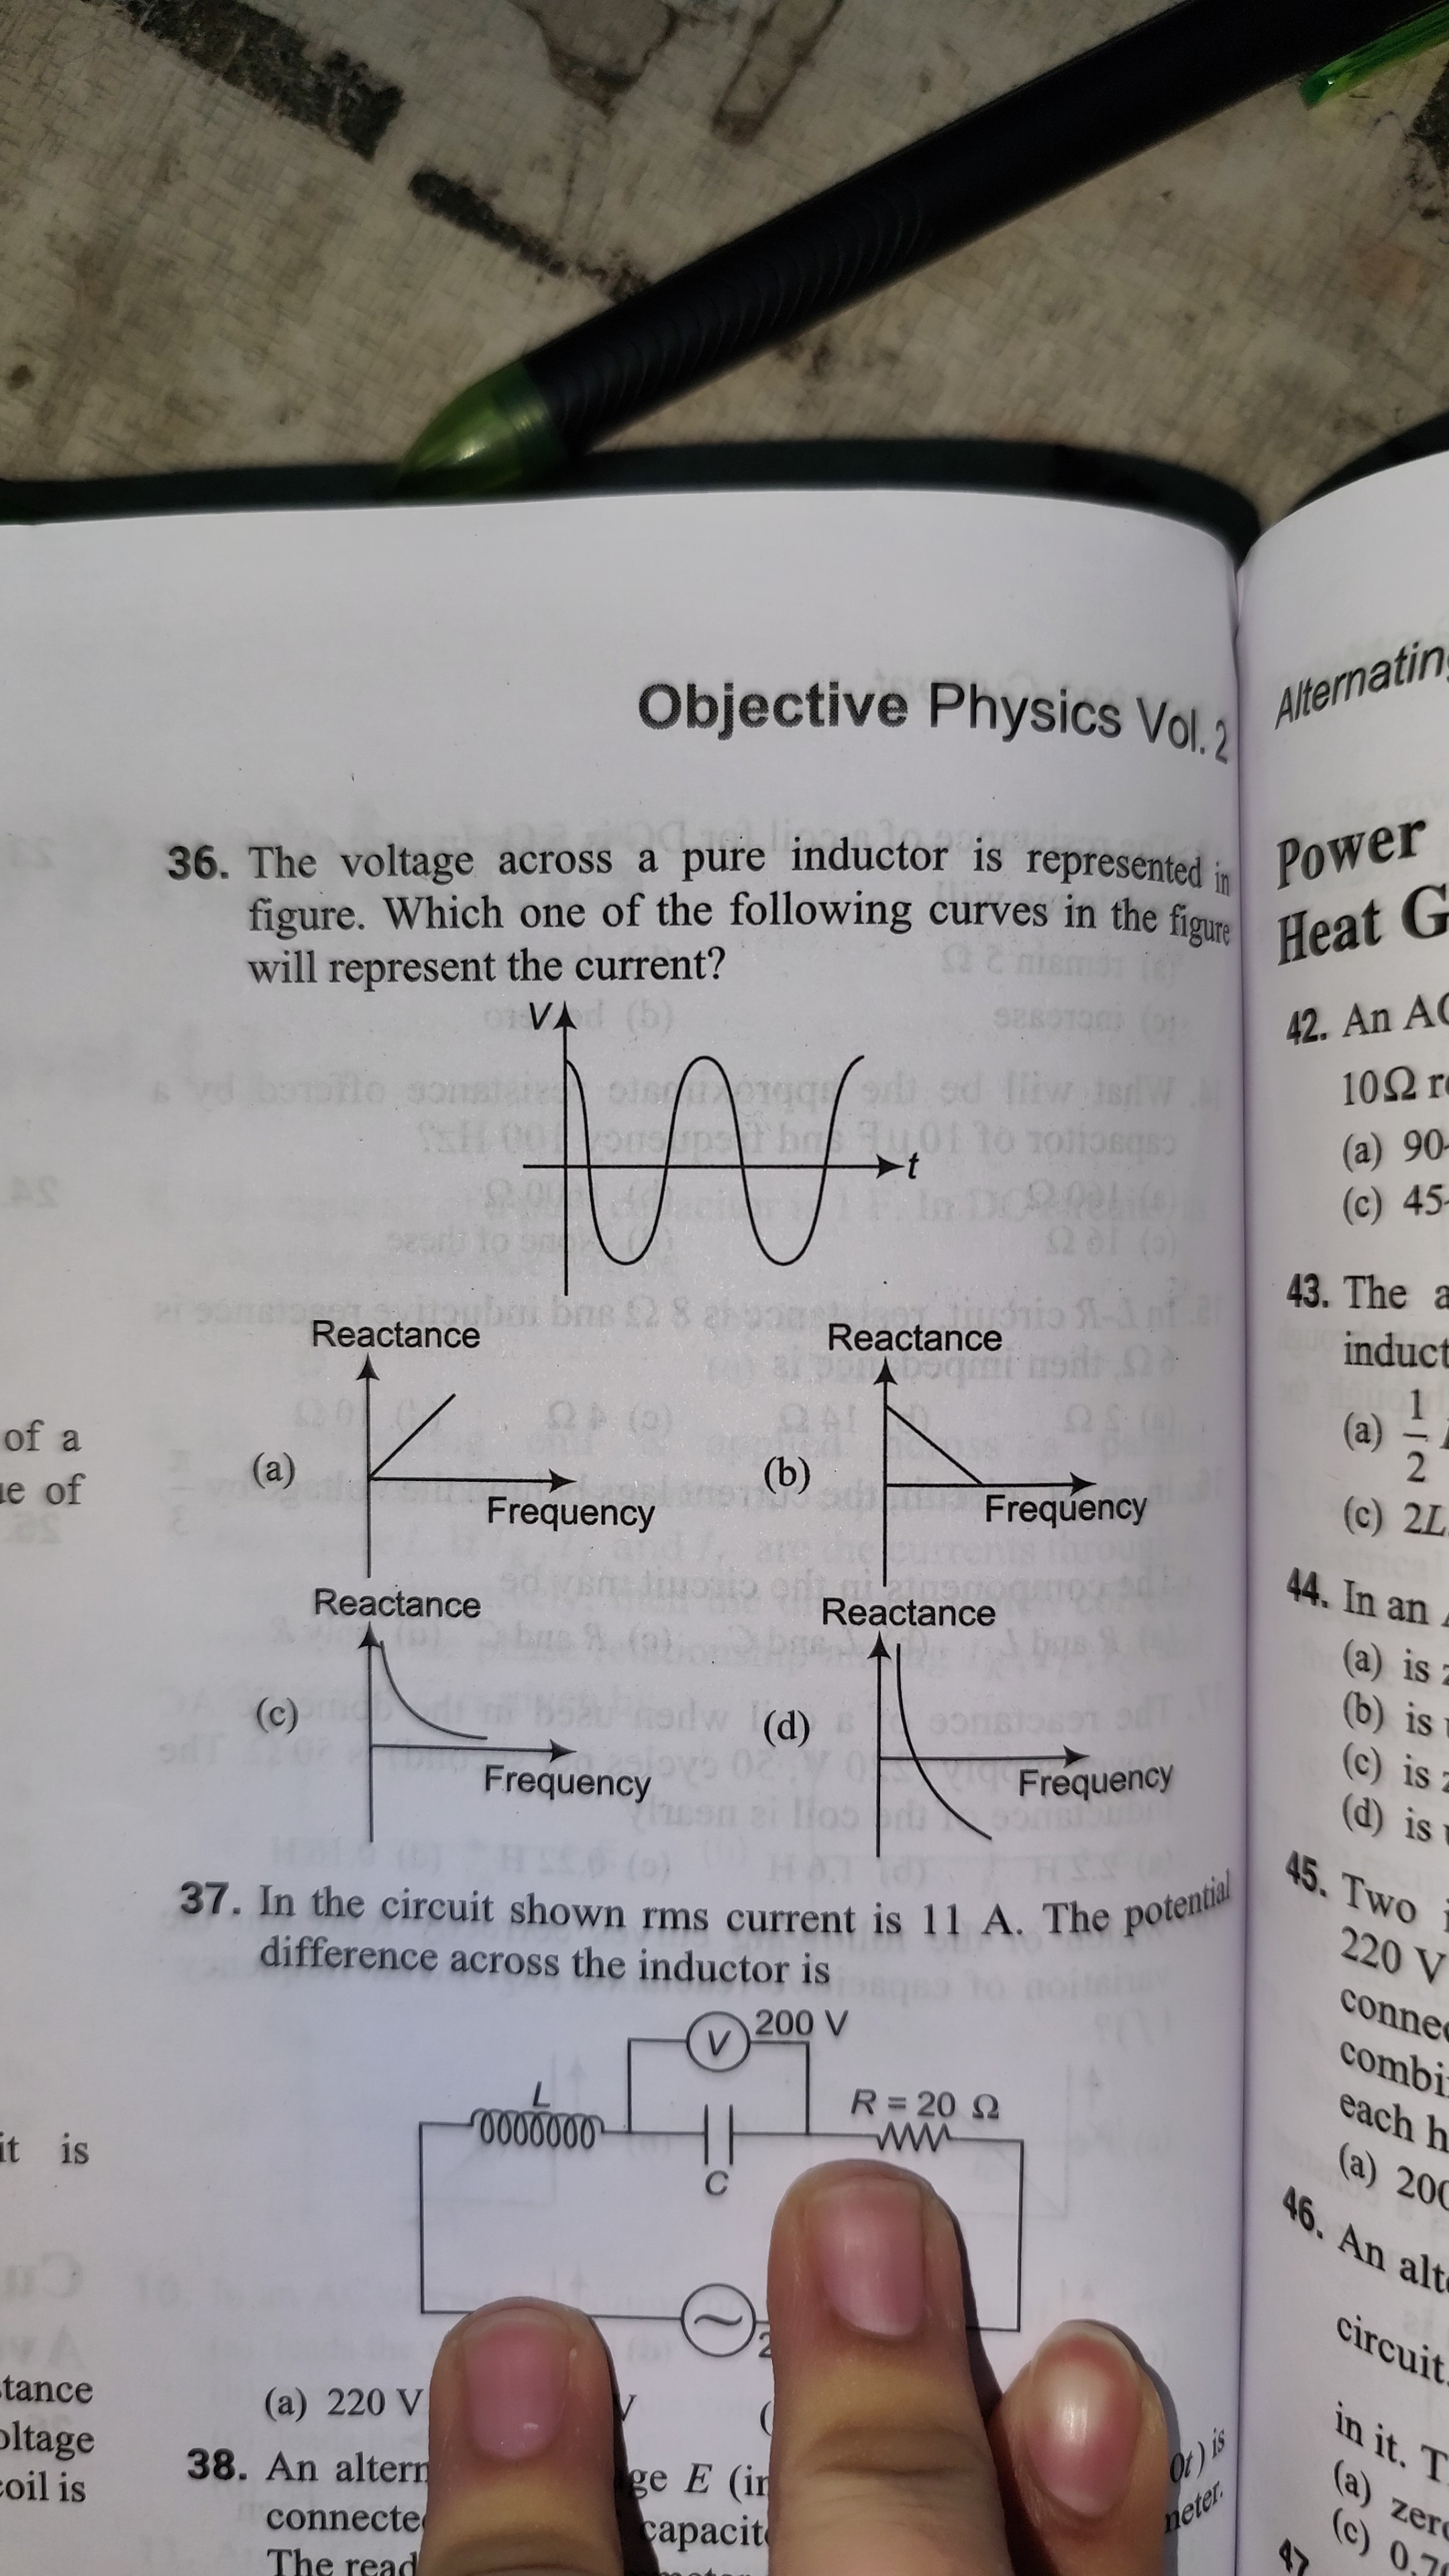
The voltage across a pure inductor is represented in figure. Which one of the following curves in the figure will represent the current?
Frequency
Frequency
Frequency
Frequency
The question as stated has a mismatch with the options provided. Assuming the question implicitly asks for the graph of reactance versus frequency for a pure inductor, the correct option is (a).
Solution
For a pure inductor, the inductive reactance (XL) is given by the formula:
XL=ωL
where ω is the angular frequency and L is the inductance. Since ω=2πf, where f is the linear frequency, the formula becomes:
XL=2πfL
This equation shows that the inductive reactance (XL) is directly proportional to the frequency (f). A graph representing direct proportionality is a straight line passing through the origin with a positive slope. Therefore, graph (a) correctly represents the reactance of a pure inductor as a function of frequency.