Question
Question: Michael swam 2000 yards on each of 18 days. The scatterplot below shows his swim time for and corres...
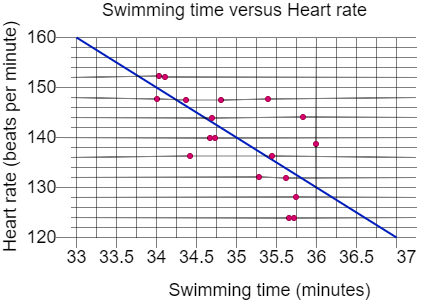
Michael swam 2000 yards on each of 18 days. The scatterplot below shows his swim time for and corresponding heart rate after each swim. The line of best fit is also shown below. For the swim that took 34 minutes, Michael's heart rate was about how many beats per minute less than the rate predicted by the line of best fit?
(a) 1
(b) 2
(c) 3
(d) 4
Solution
We solve this problem by finding the equation of line of best fit. Here, in the figure shown above the dots are the actual heart beat corresponding to time while the line is an approximation or average of the heart beats with respect to time. As we can find the actual heartbeat through dots and from the line equation we find approximations and subtract them to find the answer.
Complete step by step answer:
From the figure we are given with the scatterplot of swim time with corresponding heart rate.
In the time of 34 minutes we can see that from the scatterplot the heart beat is 152.
Now, let us take the end points of the given line of best fit asP(33,160)andQ(37,120).
We know that the slope of two points(x1,y1),(x2,y2)is given as
m=x2−x1y2−y1
By using this formula the slope of ‘PQ’ is