Question
Question: Make a graph of \(f\left( x \right)=x+\left[ x \right]\)....
Make a graph of f(x)=x+[x].
Solution
we will make use of the properties of the greatest integer function to plot the given graph. We will draw the graph of the function by considering a few rational numbers and then obtaining the value of f(x) for those x and then we will get our answer.
Complete step by step answer:
Before starting the sum, we need to understand how functions of this type work. Basically the meaning of the graph function f(x)=x+[x].
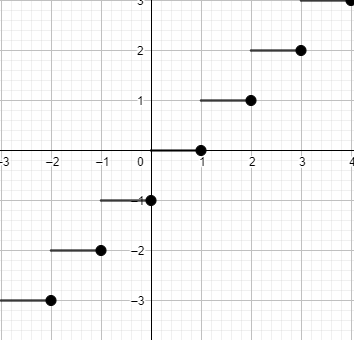
We know that greatest integer of x is always represented as [x], and it has a property that if we put some rational number as the value of x then we obtain the value of [x] as the integer less than or equal to x. So we get the curve of [x]as
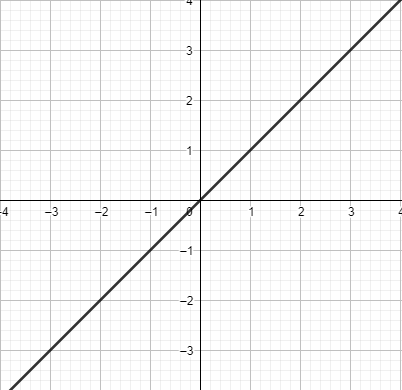
Now, we will draw the graph of x and then we will combinedly draw the graph of f(x).
Now, when we will calculate the values of f(x), we will get
For x = 1
f(1) = 1+1=2
For x = 1.5
f(1.5) = 1.5+1=2.5
For x = 3.7
f(3.7) = 3.7+3=6.7
For x = -2.5
f(2.5) = -2.5+(-3)=-5.5
Therefore, we get the graph of the function as
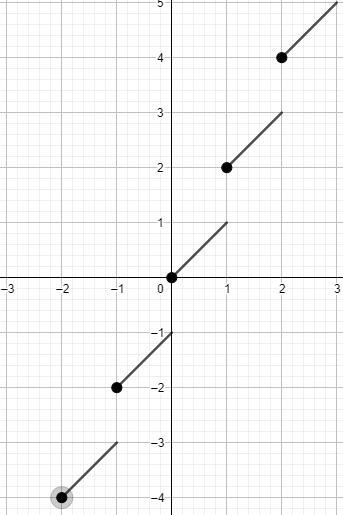
So, this is the graph of y=f(x)=x+[x].
Note: A modulus function is a function that will always yield a positive output. Make sure to plot the points exactly in accordance with the values obtained. And check all the values of x and y by putting them into the equation. And then plot the points on the graph and make this.