Question
Question: Let R be the set of real numbers. Define the real function \(f:R\to R\) by \(f\left( x \right)=x+10\...
Let R be the set of real numbers. Define the real function f:R→R by f(x)=x+10. Sketch a graph of the function.
Solution
In this question, we are given a function f defined on real numbers as f(x)=x+10. We need to sketch a graph for this function. For this, we will first define the domain and range of the function. After that, we will find the values of x and y which can be plotted on the graph.
Complete step-by-step solution
Here, we are given a function as f:R→R by f(x)=x+10. This means that function f is defined from the set of real numbers to the set of real numbers. Hence, domain (or we can say the value of x) is the set of real numbers, as well as range (or we can say the value of f(x) or y), is also the set of real numbers.
Now let us find some coordinate for the function f(x)=x+10.
Let us suppose the value of x is 0, so the value of y becomes equal to x+10=0+10=10. Hence we get the point as (0,10).
Putting the value of x as 1, the value of y becomes equal to x+10=1+10=11. Hence we get a point as (1,11).
Putting the value of x as 2, the value of y becomes equal to x+10=2+10=12.
Putting the value of x as -1, the value of y becomes equal to x+10=−1+10=9.
Putting the value of x as -2, the value of y becomes equal to x+10=−2+10=8.
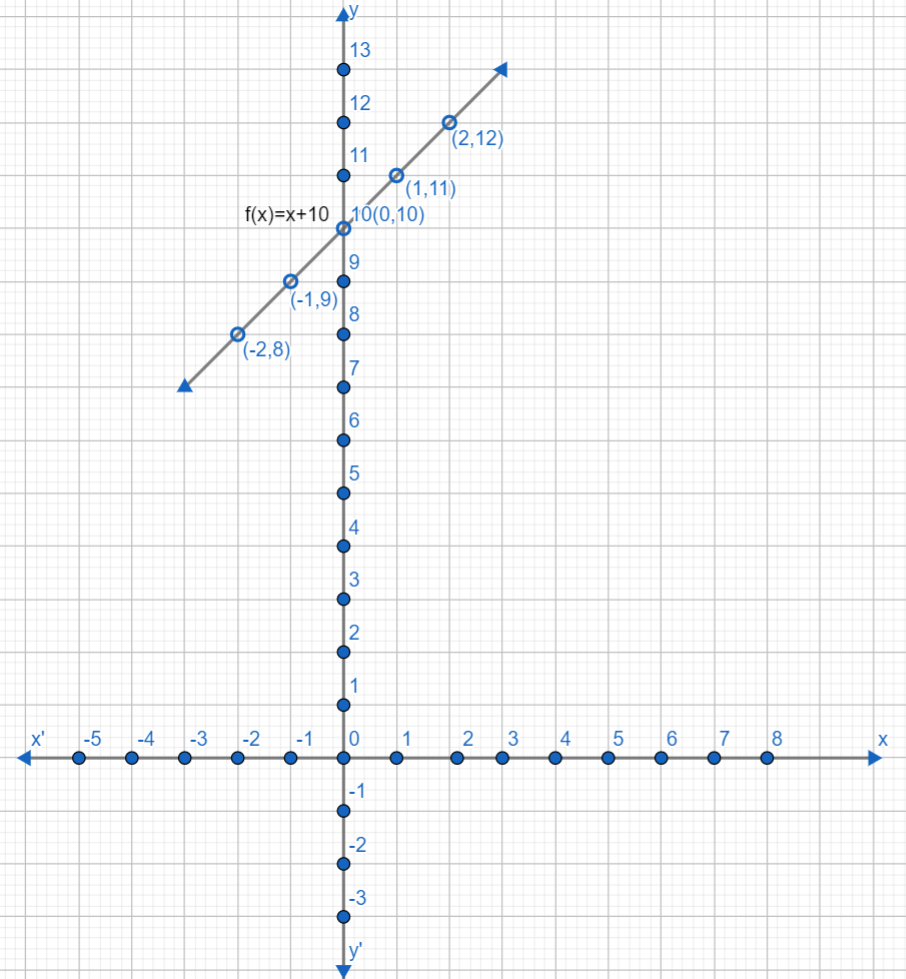
Hence, some of the coordinate of the function f(x)=x+10 are (0,10),(1,11),(2,12),(−1,9),(−2,8).
Now, let us plot this point on a graph. For positive values of x, we will move towards the right side from the origin. For the negative values of x, we will move towards the left side from the origin. For the positive values of y, we will move above the origin, and for the negative values of y, we will move below the origin. Our graph looks like this:
Note: While plotting the points on the graph, make sure that x is taken on the horizontal axis and y is taken on the vertical axis. Take an equal distance between the squares. Take care of the signs while finding the coordinates of the points.