Question
Question: Let \(f:\left[ {0,4\pi } \right] \to \left[ {0,\pi } \right]\) be defined by \(f\left( x \right) = {...
Let f:[0,4π]→[0,π] be defined by f(x)=cos−1(cosx) . The number of points x∈[0,4π] satisfying the equation f(x)=1010−x is.
Solution
The number of points of satisfaction is the points of intersection between the two given functions.
Try to draw the graph of both given functions and graphically find the point of intersection.
Intersection points are the points where the graph of both given functions cut each other.
The slope of a straight line Ax+By+C=0, is given by the derivative of the equation of the line with respect to x.
For the function f(x):x→y, the domain of the function is the set of all possible values of x for which the function is defined. The range of the function is the set of all output values of the function at x.
Complete step-by-step answer:
Step 1: Draw a graph of f(x)=cos−1(cosx)
To draw the graph of f(x)=cos−1(cosx) , we will use both the functions cosx and cos−1x.
Let us consider the graph of the trigonometric function f(x)=cosx
Let y=f(x)
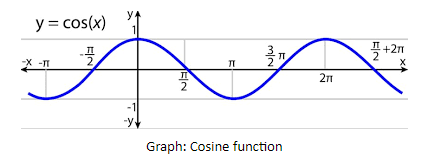
The function cosx is defined on all the real values of the x. Thus,
Domain: R , where R is the set of real numbers.
The maximum output value of the function cosx is +1 and the minimum output value is -1, and all other values of cosx lie between +1 and -1. Thus,
Range: [−1,1]
Now, let us consider the graph of the inverse trigonometric function f(x)=cos−1x :
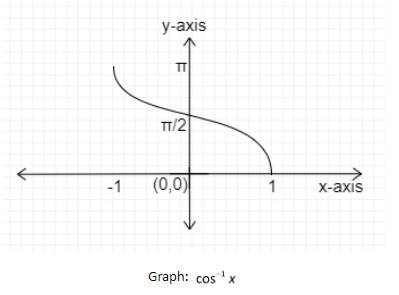
It is taking the values from +1 to -1. So, Domain = [−1,1]
The output values of the function are from 0 to π. So, Range = [0,π]
Now draw the Graph of f(x)=cos−1(cosx)
Given that the function is defined for f:[0,4π]→[0,π]
For the interval x∈[0,π]
From the above graph of the function f(x)=cosx , the output values for the interval [0,π] is between -1 and +1. The output value ofcosx is the input value of cos−1x .
And from the above graph of the function f(x)=cos−1x , the output values for the interval [−1,+1] is 0 to π. Thus,
f(x)=cos−1(cosx)=x
⇒f(x)=x
( Let y=f(x)
Differentiation dxdy gives the slope of the function.
i.e. y=x, a straight line with slope dxdy=1)
The range for the interval x∈[0,π] is f(x)∈[0,π]
Thus the graph of f(x)=cos−1(cosx) in the interval x∈[0,π] is a straight line with slope 1.
For the interval x∈[π,2π]
From the above graph of the function f(x)=cosx , the output values for the interval [π,2π] is between -1 and 0.
In f(x)=cos−1(cosx) , the domain is the range of cosx , but for the domain∈[−1,0] , the function cos−1x is not defined.
Therefore, using the property of the cosine function cosx=cos(2π−x)
f(x)=cos−1(cosx)
Therefore, f(x)=cos−1(cos(2π−x))=2π−x
⇒f(x)=2π−x
(Let y=f(x)
Differentiation dxdy gives the slope of the function.
i.e. y=2π−x, a straight line with slope dxdy=−1)
For x=π,
f(x)=2π−π=π
For x=2π,
f(x)=2π−2π=0
The range for the interval x∈[π,2π] is f(x)∈[0,π]
Thus the graph of f(x)=cos−1(cosx) in the interval x∈[π,2π] is a straight line with slope -1.
Therefore, the drawn graph of f(x)=cos−1(cosx) is the following:
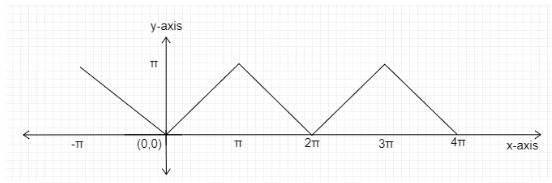
Graph: f(x)=cos−1(cosx)
Step 2: Draw graph of f(x)=1010−x
We have drawn the graph of one given function. Now let’s draw the function of other given functions to find the intersection points between them.
f(x)=1−10x
| x | 0 | 10 |
|---|---|---|
| y | 1 | 0 |
Point 10≃3π
Let y=f(x)
Differentiation dxdy gives the slope of the function. Thus,
The slope of the line f(x)=1−10x, is dxdy=−1
Therefore, the drawn graph f(x)=1010−x is the following:
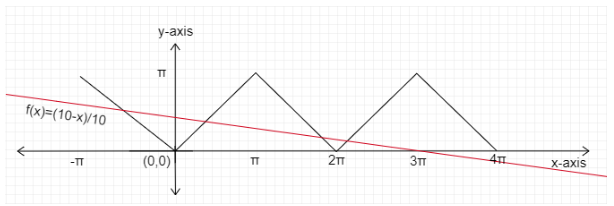
Graph: f(x)=1010−x
Step 3: Count the point of intersection from the graph:
For x∈[0,4π]
Function f(x)=cos−1(cosx) and f(x)=1010−x intersects each other 3 points shown as below:
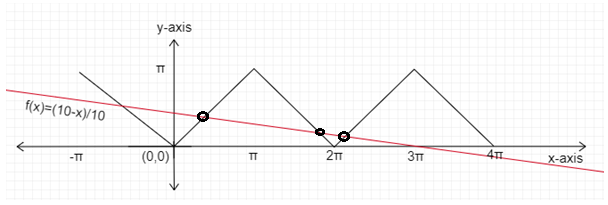
Final answer: At 3 points function f(x)=cos−1(cosx) satisfies f(x)=1010−x in the interval x∈[0,4π]
Note: Following graphs will be useful in future reference.
Graph of the sine function.
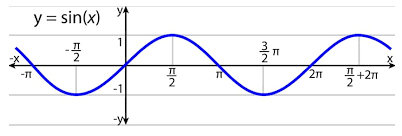
The function sinx is defined on all the real values of the x. Thus,
Domain: R , where R is the set of real numbers.
The maximum output value of the function sinx is +1 and the minimum output value is -1, and all other values of sinx lie between +1 and -1. Thus,
Range: [−1,1]
The graph of sinx and cosx is shifted by 2π. Thus, we can also interchange between sine and cosine function as well by using the relation: sinx=cos(2π−x) or cosx=sin(2π−x) .
Graph of sine inverse function.
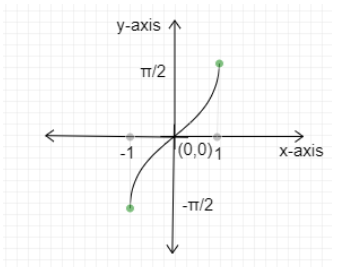
It is taking the values from +1 to -1. So, Domain = [−1,1]
The output values of the function are from −2π to 2π. So, Range = [−2π,2π]