Question
Question: In the plots of radial distribution function for the hydrogen 3s orbital vs ‘r’ , the number of peak...
In the plots of radial distribution function for the hydrogen 3s orbital vs ‘r’ , the number of peaks are:
A.3
B.2
C.1
D.0
Solution
To find the number of peaks , draw the 3s vs ‘r’ graph for hydrogen atom. Or to calculate theoretically , find the number of the radial nodes of the distribution . Radial node +1 will give us the number of peaks.
Complete answer:
Schrodinger gave the electron wave equation which tells us the maximum probability of finding the electron. The equation is: ∂x2∂2φ+∂y2∂2φ+∂z2∂2φ+h22m(E−U)φ=0
where φ = wave function of the matter ( electron ) wave. φ2 is the probability distribution of electrons. This tells us where the electron is most probable to be found. For 3s electrons we will find the value of principal quantum number and azimuthal quantum number. Here ,
n ( principal quantum number)= 3 l( azimuthal quantum number)=0 ( for s- orbital , value of lis 0).
We will now try to draw the graph of 3s versus ‘r’ . Before that we need to keep following points in mind:
-Calculate the number of radial nodes using the formula n−l−1.
-Radial nodes= number of cuts on x-axis ( r).
-The curve should start from zero. It can be positive or negative.
-Size of the curve increases after touching the x- axis every time .
-By keeping all this, we get the following curve:
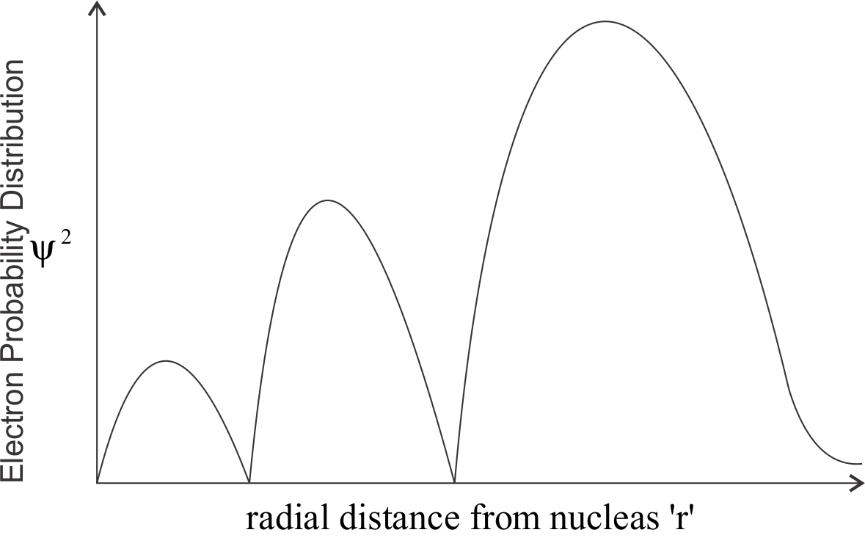
We can clearly observe the number of peaks which is 3. The graph touches the x- axis two times , hence the number of radial nodes is 2.
So by this observation we can say that the correct answer would be option B.
Note:
A node refers to a region where the probability of finding an electron is zero. The number of radial and angular nodes differ from orbital to orbital.