Question
Question: In the graphs below, the resistance R of a superconductor is shown as a function of its temperature ...
In the graphs below, the resistance R of a superconductor is shown as a function of its temperature T for two different magnetic fields B1 (solid line) and B2 (dashed line). If B2 is larger than B1 which of the following graphs shows the correct variation of R with T in these fields?
A. 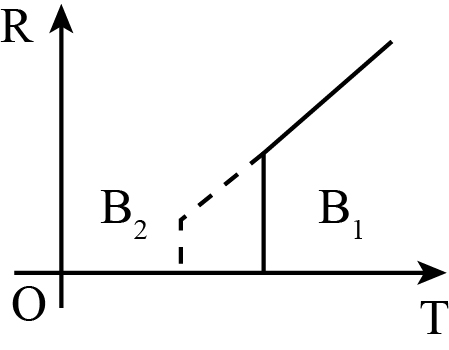
B. 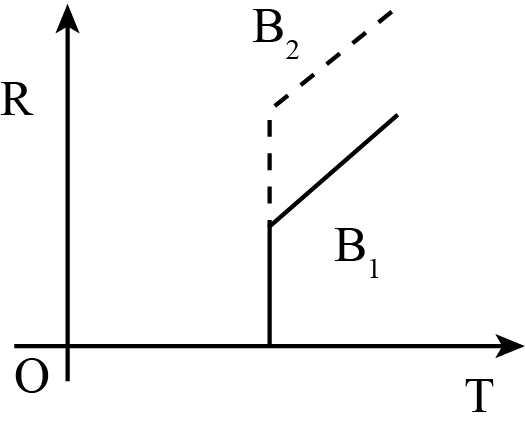
C. 
D. 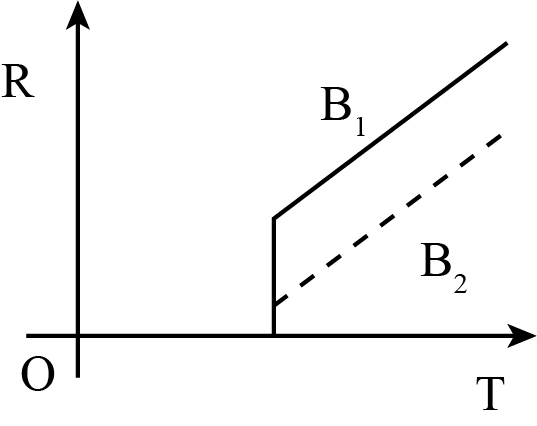
Solution
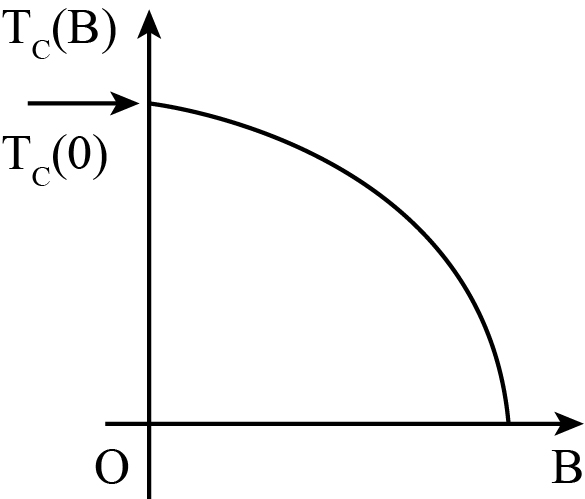
The above problem can be resolved using the concepts and the fundamentals of the magnetic field and the critical temperature. It is known that the magnitude of the magnetic field will vary inversely with the value of the critical temperature of the system. It means, at the higher critical temperature, the magnitude of the magnetic field is much lesser. On the other hand, at the lower critical temperature, the magnetic field's magnitude is much higher.
Complete step by step answer:
It is given that B2 is larger in magnitude as compared to B1. And the magnetic field varies inversely with the critical temperature (T) as,
B∝T1
Therefore, the graph showing the correct variation of R with T in these fields is as plotted in (A)
So, the correct answer is “Option A”.
Note:
To resolve the given problem, one must understand the magnetic field's meaning and fundamentals and the critical temperature. The magnetic field is any region that can be considered when there is some magnitude of magnetic force being applied to that specific region or the point. And the critical temperature is the value of temperature, upon which the further vaporization of any liquid substance cannot be made possible. Therefore, there is an inverse dependency of the magnetic field's magnitude and the value of critical temperature. And there is an appropriate graph showing this variation, which is needed to be analysed and remembered.