Question
Question: In the given figure the P-V curve of an ideal gas is given. During the process, the cumulative work ...
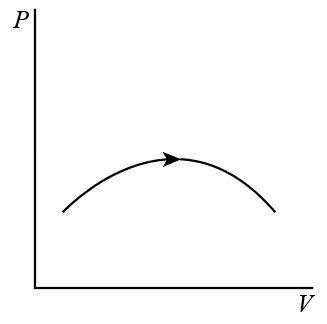
In the given figure the P-V curve of an ideal gas is given. During the process, the cumulative work done by the gas
A. continuously increases
B. continuously decreases
C. first increases then decreases
D. first decreases then increases
Solution
The question is from the thermodynamics of gases. In this question we have to find the total work done during the process whose P-V curve is given. For this week I have to analyze the graph given in the question and give assertions about what will be the work done by the gas.
Complete step by step answer:
We know that in any kind of thermodynamics process, work done is proportional to the change in pressure and volume. Therefore, in the given curve we have to see the change in pressure and volume to comment about the work done.
Work done is directly proportional to change in both pressure and volume, hence if any of the two are increasing then the work done will be increasing if we look at the graph and divide it into two halves, first in which the curve is going up and the second in which the curve is going down. We see that when the curve is going up the volume is constantly increasing as well as the pressure, and in the second half even though the pressure is decreasing the volume is constantly increasing.
Hence in both of the halves of the curve, either pressure or volume or both pressure and volume are increasing. Hence the cumulative work done will always be increasing.
Thus, the correct option is (A).
Note:
This type of questions tests the contextual knowledge of the students. In these questions students have to use the relation between the quantities, but not for calculations but for checking the effect when either of the quantities are increased or decreased. Questions can be easily solved if the relations are clear to the students. Also, for solving such types of questions students should have knowledge about how to read a graph.