Question
Question: In the given figure, a fixed mass of an ideal gas undergoes the change represented by XYZX above. Wh...
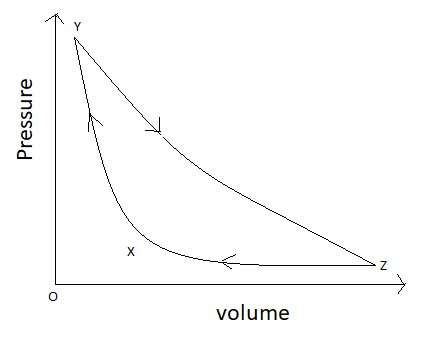
In the given figure, a fixed mass of an ideal gas undergoes the change represented by XYZX above. Which one of the following sets could describe these changes?
A) XY→ Isothermal expansion, XZ→Adiabatic compression and ZX→ compression at constant pressure.
B) XY→Adiabatic compression, YZ→Isothermal compression and ZX→ Pressure reduction constant volume.
C) XY→Isothermal compression, YZ→Adiabatic compression and ZX→ Compression at constant pressure.
D) XY→Adiabatic compression, YZ→Isothermal expansion and ZX→ compression at constant pressure.
Solution
In the given figure is drawn between a fixed mass of an ideal gas that undergoes the represented by XYZX above. The perfect gas relationship among the volume, the temperature, the pressure, and the amount of can also combine. So we use this way and we conclude the answer.
Complete step by step answer:
For an isothermal process: A thermodynamic process, which the temperature of a system remains constant in an isothermal process. Happens so slowly that thermal equilibrium is maintained for the transfer of heat into or out of the system. The change of a substance, object or system is known as Isothermal Process at a particular constant temperature.
Here we can write it as pv= Constant
Where, p is the Pressure of the system, and v is the Volume of the system,
PdV=−dPV
Now we can take the differentiation as LHS and remaining as RHS we get,
dVdP=V−P
For adiabatic process: In the thermodynamic process, if there is no exchange of heat from the system and also to its surrounding neither during the expansion nor during the compression,
PVγ=Constant
Where, γ Is the Adiabatic index and is defined as the ratio of heat capacity at constant pressure cp to heat capacity at constant volume cv.
dVdP=−γVP
Now, XY the volume is reduced in the curve and it represents the adiabatic compression as it's in the form of a slope that is steeper than the isothermal graph. The curve YZ is increasing in volume and the graph best represents the isothermal expansion.
Now, XZ is slope line zero to the pressure axis with decrease in volume, Hence it represents the compression at constant pressure.
So, the correct answer is option (D).
Note: An Isothermal process: It’s for considered reversible processes because you have to complete a process (here we have an example, an isothermal expansion). Also, you will be able to have the equivalent process reverse (an isothermal compression) and return the system to its original state.
Adiabatic processes: This there is no exchange of heat from an adiabatic processes, the system to its surrounding neither during expansion nor during compression. It can be either reversible or irreversible.