Question
Question: In the adjoining figure is shown the time- distance \[\left( {t - s} \right)\] graph of a cyclist. F...
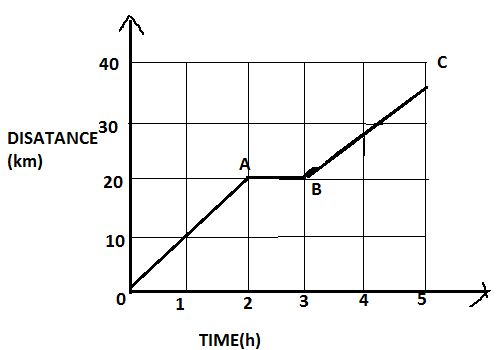
In the adjoining figure is shown the time- distance (t−s) graph of a cyclist. Find out from the graph:
(i) Maximum speed of the cyclist.
(ii) Average speed in the whole journey.
Solution
We know that motion is a change in the position of an object with time. In order to specify the position, we need to use a reference point and a set of axes. Graphical analysis is a convenient method of studying the motion of particles. It can be effectively applied to analyze the motion of a particle.
Complete step by step answer:
Consider a given graph; mark its distance as OA, AB and BC respectively,

In general, speed is a ratio of distance by time taken.
That is, speed = timedistance
A cyclist travels a distance of 20km that is OA in 2 hours then, speed is given by,
s=td
⇒s=220
⇒s=10kmh−1
And from A to B, there is no distance travelled by the cyclist. Means, a cyclist is at rest for one hour.
Thus, speed is zero.
Next, form b to c cyclists travels a distance of 15km in 2 hours. This is less than 20km. Therefore,
Speed is given by,
s=td
⇒s=215
⇒s=7.5kmh−1
Thus, from these we can say, the maximum speed of the cyclist is 10kmh−1. That is from 0 to a.
Average speed is the ratio of total distance to the total time taken.
⇒average speed = total timeaverage distance
Total distance travelled by the cyclist is 20+0+15=35km
And total time taken=5 hours
Then, average speed = 535=7kmh−1
∴ The maximum speed of the cyclist is 10kmh−1 and the average speed in the whole journey is 7kmh−1.
Additional information:
For graphical representation, we require two coordinate axes. For usual representation we will consider the x-axis and y-axis. Distance-time graph is represented by plotting distance along the y-axis and time is along the x-axis. A straight line parallel to X-axis in the distance-time graph tells us an object is at rest.
Note:
The slope of distance-time gives the velocity of the particle.
Displacement of a particle is the shortest distance between the initial and final position of the body.
Distance is the total path length covered by the body.