Question
Question: In an experiment on the photoelectric effect, an evacuated photocell with a pure metal cathode is us...
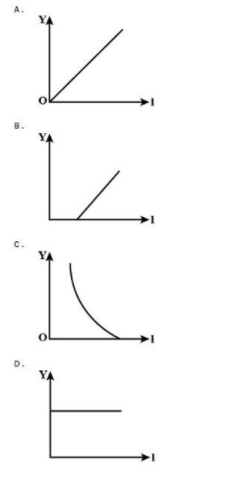
In an experiment on the photoelectric effect, an evacuated photocell with a pure metal cathode is used. Which graph best represents the variation of V, the minimum potential difference to prevent current from flowing, when x, the frequency of the incident light, is varied?
Solution
Try to get the equation of straight line, y=mx+c, by manipulating the Einstein‘s equation for Photoelectric effect, that is, Emax=hf−ϕ0.
Complete step by step solution:
We know, the Einstein’s equation for photoelectric effect is given by,
Emax=hf−ϕ0
Where, Emax=maximum kinetic energy of the electrons that are emitted from the cathode
h=Planck’s constant
f=frequency of the incident light
ϕ0=hf0=work function of the metal from where the electron is emitting and it is related to the threshold frequency f0.
The work function of the metal is the minimum amount of work of energy required to take a free-electron out of the metal against the force that is exerted by the surrounding positive ion.
When a particular amount of negative potential difference V is applied to the anode A, the current becomes zero in the photoelectric tube. This is the value of negative potential difference which just stops the electrons with maximum energy from reaching anode A. This V is known as stopping potential.
Therefore,
eV=Emax
We have, Emax=hf−ϕ0⋅⋅⋅⋅⋅⋅(1)
Substitute ϕ0=hf0 in equation(1), so we get
Emax=hf−hf0
Since, Emax=eV
Therefore,
hf−hf0=eV h(f−f0)=eV
Or V=eh(f−f0)
This equation can be interpret as:
y=eh(x−x0), which form the equation of a straight line of gradient eh.
So when the graph is plotted showing the variation of minimum potential difference on the y-axis against the frequency of incident light on the x-axis, a straight line is drawn cutting the x-axis at f0. The best graph representing it is option B.
∴ Hence the correct option is (B).
Note:
Here f0 is representing threshold frequency which is the minimum frequency of incident radiation to dislodge an electron from an atom. This energy is completely consumed in the process of photoelectric emission. It depends on the nature of the material upon which incident radiation is striking irrespective of the intensity of incident light.