Question
Question: In an experiment for determining the gravitational acceleration g of a place with the help of a simp...
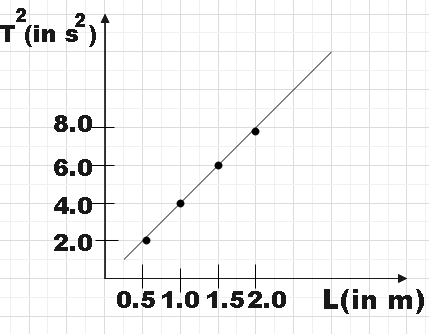
In an experiment for determining the gravitational acceleration g of a place with the help of a simple pendulum, the measured time period square is plotted against the string length of the pendulum in the figure. What is the value of g at the place?
A. 9.81m/s2
B. 9.87m/s2
C. 9.91m/s2
D. 10.0m/s2
Solution
As a very first step, you could find the slope of the given graph. Then you could recall the expression for a time period of simple pendulum and then by squaring on both sides we will get an expression which when compared with a straight line equation will give the slope. Equating this to the above found slope, you will get the answer.
Formula used:
Time period of simple pendulum,
T=2πgl
Complete step by step answer:
In an experiment for determining the gravitational acceleration g of a place with the help of a simple pendulum, the measured time period square is plotted against the string length of the pendulum in the figure. What is the value of g at the place?
In the question, we are discussing an experiment that is conducted to determine the gravitational acceleration g of that place using a simple pendulum. We are provided with a graph in which the square of the time period is plotted against the length of the string. Using all this information, we are supposed to find the gravitational acceleration of that place.
From the graph we could find the slope m.
m=2−18−4
⇒m=4 ………………………………………… (1)
Now, let us recall the expression for the time period of a simple pendulum,
T=2πgl
Squaring on both sides we get,
T2=g4π2l
Here, it is very clear that, when T2 and l are plotted against each other, the slope would be,
m=g4π2 ……………………………………………. (2)
From (1) and (2), we get,
g4π2=4
⇒g=π2
∴g=9.87ms−2
Therefore, the value of g is found to be g=9.87ms−2
So, the correct answer is “Option B”.
Note: You may recall that the acceleration due earth’s gravity is normally taken as9.8ms−2. However, this value also depends upon the location of the experimental setup as this value shows slight variation with altitude. This is also the most accurate approximation and if you end in a very different value then it must be due to some experimental error.