Question
Question: In a University, out of 100 students 15 offered Mathematics only; 12 offered statistics only; 8 offe...
In a University, out of 100 students 15 offered Mathematics only; 12 offered statistics only; 8 offered only physics; 40 offered Physics and Mathematics; 20 offered Physics and statistics; 10 offered Mathematics and Statistics; 65 offered Physics. By drawing a Venn diagram, find the number of students who (1) offered Mathematics (2) offered Statistics (3) did not offer any of the above three subjects.
Solution
Hint: At first consider the number of students who offered all the three subjects as ‘x’. Now, by the conditions given and data given, find the value of x and then find the other questions which are asked.
Complete step-by-step answer:
In the given question we are said that in a University, out of 100 students, 15 offered Mathematics only; 12 offered Statistics only; 8 offered only physics; 40 offered Physics and Mathematics; 20 offered Physics and statistics; 10 offered Mathematics and Statistics; 65 offered Physics. So, there are three questions. On the 1st we are asked to find how many students offered Mathematics, in the 2nd question we are asked to find the number of students who offered statistics and in the last question we are asked how many offer none of the three subjects mentioned.
So, let’s represents number of students who offered Mathematics, Physics and Statistics as n(M) , n(P) and n(S) respectively, both maths and physics as n(M∩P) , both physics and statistics as n(P∩S) and both mathematics and statistics as n(M∩S) all the three subjects as n(M∩P∩S) , only Mathematics as n(M only) , only physics n(P only) and only statistics as n(S only) .
Let the number of students common to subjects be ‘x’ so we can say that, n(M∩P∩S)=x.
Hence, we can also write,
n(M only)=15n(P only)=8n(S only)=12n(P∩M)=40n(M∩S)=10n(P∩S)=20n(P)=65
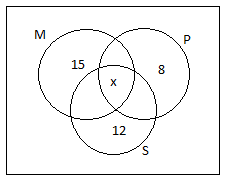
Let’s represent it as a diagram.
The values of n(M∩P), n(M∩S), and n(P∩S)also includes value of n(M∩P∩S). So the value of n(M∩P)but not S is (40−x) , n(M∩S) but not P is (10−x) and n(P∩S)but not M is (20−x) .
So, the diagram becomes,
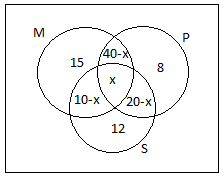
Now, we are given that the total number of students who offered Physics is 65. So, n(P)=65 .
n(P) on term of x will be n(P)==(40−x)+x+(20−x)+8 or
n(P)=68−x
So, we can say that,
65=68−x .
Hence the value of x is 3.
So we will draw the diagram as,
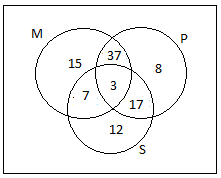
i) So, by the Venn diagram total number of students who offered maths are 15+37+3+7=62
ii) The total number of students who offered statistics are 12+7+3+17=39
iii) The total number of students are 100 so the number of students who were offered one of the subjects are 100−(15+37+7+3+8+17+12)=1
Hence, the numbers of students are 62, 39, and 1 respectively.
Note: Students generally get confused between Mathematics and only mathematics, physics and only physics, statistics and statistics only. Actually the number of students who offer Mathematics means people can read only mathematics or mathematics and physics or mathematics and statistics. The same goes for the other two subjects.