Question
Question: the variation of the induced e.m.f. $\xi$ with time t, as follows. $t_1$ as the time when the field ...
the variation of the induced e.m.f. ξ with time t, as follows. t1 as the time when the field just enters the loop, t2 as the time when the loop is fully inside the field, and t3 as the time when the field just completely leaves the loop.
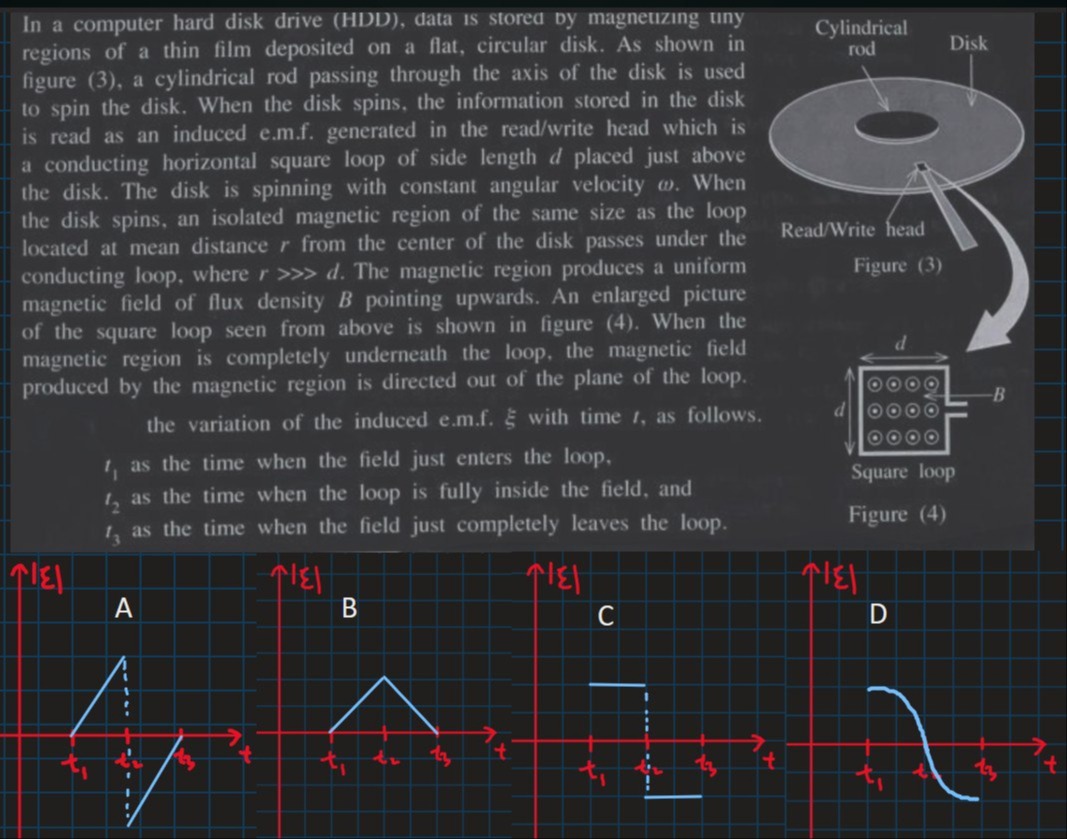
Graph A: A plot of |ξ| versus t. The graph starts at (0,0) and increases linearly to a peak at t1. It then decreases linearly to zero at t2. It then increases linearly to t3. The x-axis is labeled t, and the y-axis is labeled |ξ|. Vertical dashed lines are shown at t1, t2, and t3.
Graph B: A plot of |ξ| versus t. The graph starts at (0,0) and increases linearly to a peak at t2. It then decreases linearly to zero at t3. The x-axis is labeled t, and the y-axis is labeled |ξ|.
Graph C: A plot of |ξ| versus t. The graph starts at (0,0) and is zero until t1. It then jumps to a constant value until t3. It then drops back to zero. The x-axis is labeled t, and the y-axis is labeled |ξ|. Vertical dashed lines are shown at t1 and t3.
Graph D: A plot of |ξ| versus t. The graph starts at (0,0) and is zero until t1. It then increases smoothly to a peak and then decreases smoothly to zero at t3. The x-axis is labeled t, and the y-axis is labeled |ξ|.
Graph A (Option A)
Solution
Explanation of the Solution:
When the magnetic region (of the same size as the loop) moves under the loop at constant speed, the magnetic flux through the loop changes only during the “entry” (from the moment it just touches, at t₁, until the loop is completely covered, at t₂) and “exit” (from t₂ until it completely leaves at t₃) phases. During each of these transitions the rate of change of the overlapping area—and thus the change in flux—is nonzero. (In an idealized treatment the overlap area changes at a constant rate; in a more realistic treatment the geometry makes this rate vary smoothly with time.) In the fully‐covered interval the flux is constant so the induced emf is zero. Hence the absolute induced emf |ξ| vs. time consists of two distinct “pulses” (one for entry and one for exit) separated by a zero at t₂. Among the four given graphs the one that shows a pulse rising then falling to zero at t₂ and then exhibiting a second similar pulse is Graph A.