Question
Question: If there is an increase in a series at constant rate, the graph will be a _______. \({\text{A)}}\)...
If there is an increase in a series at constant rate, the graph will be a _______.
A) Convex curve
B) Concave curve
C) A straight line from left top to right bottom
D) A straight line from left bottom to right top
Solution
To find the answer without any doubt, we have to assume and consider a series first, and then increase the series at a constant rate i.e., with the same amount or number.
After that, we will represent in a graph and also we will be able to see the cures and lines clearly
Finally we get the required answer.
Complete step-by-step solution:
Let us assume a simple series distribution which is increasing at constant rate:
| x | 1 | 2 | 3 | 4 | 5 | 6 |
|---|---|---|---|---|---|---|
| y | 5 | 10 | 15 | 20 | 25 | 30 |
Here, every number is increasing by 5 (thus at constant rate)
Now, representing this table in the graph, we get:
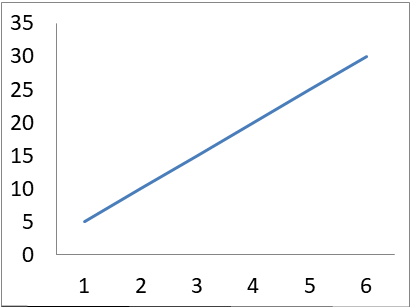
As we can see, the change in the graph is a straight line from left bottom to right top.
Hence we can conclude the correct option is (D) A straight line from left bottom to right top.
Note: In this question we have an alternative logical answer as follows:
Basically a series consists of a sequence with some common operations in it and almost in every case, the number will be increasing in certain rate and sometimes it will be in a decreasing rate too.
Considering in that way, when the numbers are increasing at a constant rate, the difference between the points will be the same and the points in the graph will also increase in a constant rate as the difference is the same, thus we will get a straight line from left bottom to right top.
In case, if the series is decreasing at a constant rate, the graph will be a straight line from left top to right bottom.