Question
Question: If \(I,II\) and \(III\) are three isotherms respectively at temperature \({T_1},{T_2}\) and \({T_3}\...
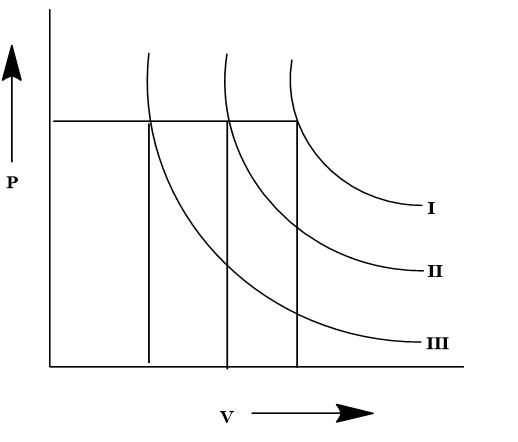
If I,II and III are three isotherms respectively at temperature T1,T2 and T3, then temperature will be in order:
A. T1=T2=T3
B. T1>T2=T3
C. T1>T2>T3
D. T1<T2<T3
Solution
The ideal gas laws which depict the relationship between Pressure, Volume and Temperature needs to be taken into account. These are the physical variables for the different gases and hence the variable values and the constant values need to be determined.
Complete step by step answer:
The given graph is a depiction of isotherm in a P−V diagram for three different temperatures, which are depicted by three specific isotherm curves. The isotherms are formed based on the specific pressure and volume at the given three temperatures, which are T1,T2 and T3. It is previously known from the ideal gas laws that the Pressure and Volume have a proportional relation with Temperature. Here three temperatures are given which are T1,T2 and T3.

Here from the given graph, it is visible that there is a single pressure level that is maintained for all the three isotherms. However, the volume changes with each isotherm as visible from the perpendicular dropped from the isotherm. The highest volume is observed from the isotherm denoted by T1 and the lowest volume is observed for the isotherm denoted by T3. It is known from ideal gas laws: PV=nRT
Therefore, taking the physical factors into account, if the pressure is constant then the changes in volume will define the different temperatures for which the isotherms are created. Therefore the comparative data let us consider the volume for T1 temperature for the isotherm I is V1. Similarly for T2 the volume will be V2 and for that of T3 the volume will be V3. Hence according to the data from the volume axis, we can get: V1>V2>V3
This proves that the trend in the isotherms and the temperature of the isotherm will be T1>T2>T3 which can be proved to be V∝T as the relation for the given P−V diagram. Therefore, the relationship between the isotherms can be defined by C. T1>T2>T3.
Note:
There are three isotherms which are plotted for three specific temperatures. The P−V diagram is used to determine the changes in the gases and hence based on the given plot the condition can be determined.