Question
Question: If f (x) = max (x, \(\dfrac{1}{x}\)) for x > 0, where max (a, b) denotes the greater of the two real...
If f (x) = max (x, x1) for x > 0, where max (a, b) denotes the greater of the two real numbers a and b. Define the function g (x) = f (x) f (x1) and plot its graph.
Solution
We will first define max {m (x), n (x)} and them we will divide the function f (x) = max (x, x1) into two sub – intervals namely x > x1and x < x1. Then we will plot the graphs of both x and x1. Then, we will define the function f (x) = max (x, x1)and then using it,
we can define f (x) = max ( x1, x) and thereby we can define g (x) = f (x) f (x1).
Complete step-by-step answer:
We are given f (x) = max (x, x1).
We can define the function p (x) = max {m (x), n (x)} as
p (x) = \left\\{ {\begin{array}{*{20}{c}}
{m\left( x \right);m\left( x \right) > n\left( x \right)} \\\
{n\left( x \right);n\left( x \right) > m\left( x \right)}
\end{array}} \right.
Hence, we can define the given function f (x) = max (x, x1)if we divide it into two sub – intervals as x > x1and x < x1. We can plot the graph of x and x1 at the same graph, hence determining the exact functional form.
Graph:
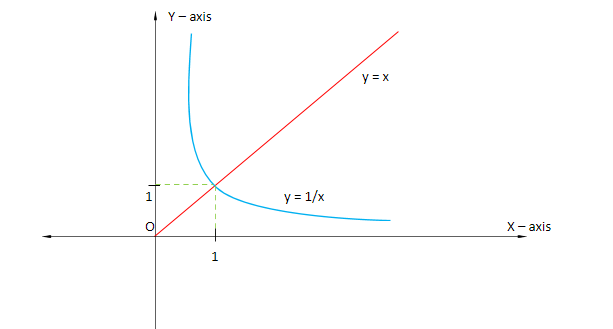
In the graph, the blue curve represents the graph of x1 and the red line represents the graph of x.
From the graph and by the definition of p (x) = max {m (x), n (x)}, we can say that
⇒f (x) = max (x, x1) = \left\\{ {\begin{array}{*{20}{c}}
{\dfrac{1}{x};x \in \left( {0,1} \right]} \\\
{x;x \in \left[ {1,\infty } \right)}
\end{array}} \right.
We can say that f (x) = max (x1, x) = \left\\{ {\begin{array}{*{20}{c}}
{\dfrac{1}{x};x \in \left( {0,1} \right]} \\\
{x;x \in \left[ {1,\infty } \right)}
\end{array}} \right.
We can check by assuming x = 3 or 4 and 31or 41(just for example)
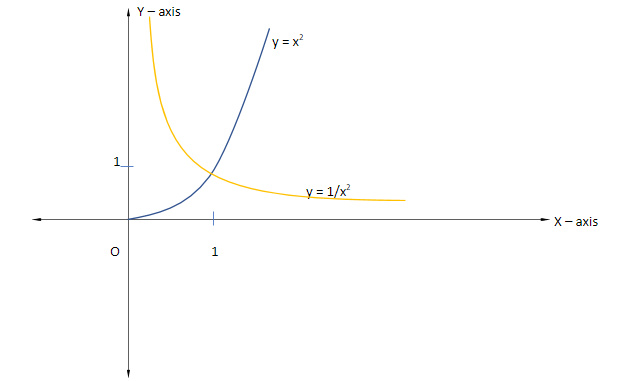
Therefore, g (x) = f (x) f (x1) can be defined as:
⇒ g (x) = f (x) f (x1) = \left\\{ {\begin{array}{*{20}{c}}
{\dfrac{1}{{{x^2}}};x \in \left( {0,1} \right]} \\\
{{x^2};x \in \left[ {1,\infty } \right)}
\end{array}} \right.
Now, we can plot its graph as:
Note: In such questions, you may get confused while defining the functions and their range. Be careful in plotting the graphs of all the four functions and defining the acceptable region. You can also solve the first part of the question by defining the range of the function x and x1 instead of plotting the graph.