Question
Question: How would you graph \( y = \ln \left( {x - 1} \right) + 3 \) ?...
How would you graph y=ln(x−1)+3 ?
Solution
Hint : A graph of a function f is the set of ordered pairs; the equation of graph is generally represented as y=f(x) , where x and f(x) are real numbers. We substitute the value of x and we determine the value of y and then we mark the points in the graph and we join the points.
Complete step by step solution:
Here, in the given question, we have to plot the graph for the given function. A graph of a function is a set of ordered pairs and it is represented as y=f(x) , where x and f(x) are real numbers. These pairs are in the form of cartesian coordinates and the graph is the two-dimensional graph.
First, we have to find the value of y by using the graph equation y=ln(x−1)+3 .
Let us substitute the value of x as 2 .
⇒y=ln(2−1)+3
⇒y=ln(1)+3
We know that the value of ln(1) is zero. So, we get,
⇒y=0+3
⇒y=3
Now we consider the value of x as e+1 , the value of y is
⇒y=ln((e+1)−1)+3
Simplifying the expression,
⇒y=ln(e)+3
Now, we know that the value of ln(e) is one. So, we get,
⇒y=1+3
⇒y=4
Now we consider the value of x as e2+1 , the value of y is
⇒y=ln((e2+1)−1)+3
Simplifying the expression,
⇒y=ln(e2)+3
Now, we know that the value of ln(e) is one. So, we get,
⇒y=2+3
⇒y=5
Now we draw a table for these values we have
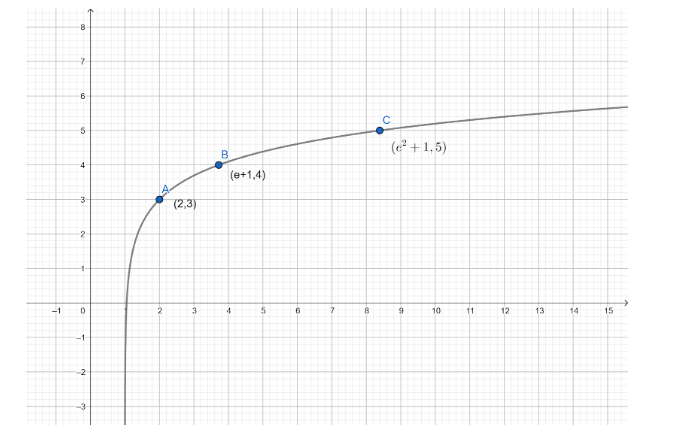
| x | 2 | (e+1) | (e2+1) |
|---|---|---|---|
| y | 3 | 4 | 5 |
We also know the nature of the graph of logarithmic function. Hence, we can now plot the graph of the given function y=ln(x−1)+3 with the help of coordinates of the points. The nature of the graph of a function and its slope can also be determined from the derivative of the function. The graph plotted for these points is represented below:
Note : The number ‘e’ in mathematics is known as the euler’s number. It is a mathematical constant and has a value approximately equal to 2.71828 . It is the base of the natural logarithm that is used in many steps in the given problem.