Question
Question: How would you graph \(f(x) = 2\ln x\) ?...
How would you graph f(x)=2lnx ?
Solution
We will first start by evaluating the x-intercept mathematically. We take all the like terms to one side and all the alike terms to the other side. Then we start plotting the graph, first we will mark all the points and then finally plot the graph.
Complete step by step answer:
We will start off by evaluating the value of the x-intercept.
Now if y=2lnx then lnx=2y.
We can also write this by another way,
e2y=x …… (1)
The x-intercept will be evaluated when y=0.
Hence, equation (1) becomes,
x=e20 ⇒x=e0 ⇒x=1
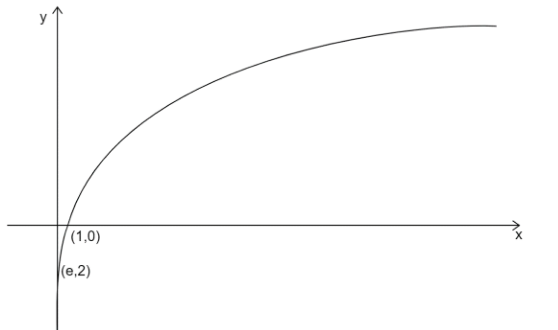
Hence, the x-intercept will be at x=1.Now, to plot the graph we will start by building a table of values. The top row will be having the values of x. Then the next row down would have the values of lnx and the row next below that would have the values of 2×lnx. The last row will be giving us the values for y. Now we will mark the series of points that matches both your value of x and also the calculated value of y.
| Sr. No. | x | y |
|---|---|---|
| 1 | 1 | 0 |
| 2 | e | 2 |
So, now we will plot the graph.
Note: While evaluating the x-intercept, make sure to take all the x-terms to one side and all the other terms to another side. While making a table for the values of x and y make sure you back trace the values to avoid any mistakes. While plotting graphs, always start with the drawing of axes then the points and then join all the points.