Question
Question: How will you plot the graph for the equation \[y = \sec x\] ?...
How will you plot the graph for the equation y=secx ?
Solution
In this equation, we have to draw/ plot the graph for the equationy=secx. We know that secxis the reciprocal of cosx. So, the graph can be drawn easily if we know the graph of cosx.We need to find reciprocal of each y value that we have obtained for cosx .
Complete step-by-step answer:
We will draw a table including different values fory=cosx, and then we will find it’s reciprocal (y1) for the value ofy=secx.
| x | y=cosx | y1=secx |
|---|---|---|
| 0 | 1 | 1 |
| 1 | 0.54 | 1.85 |
| 1.55 | 0.02 | 48.09 |
| 2 | −0.42 | −2.4 |
| 3 | −0.99 | −1.01 |
| 4 | −0.65 | −1.53 |
We have included a value just smaller than 2π=1.57 so that we will get an idea what goes on there.
After applying the concept of reciprocal throughout the range of xvalues, we will proceed to plot the graph of y=secx . The graph of y=secx=cosx1 for 0⩽x<25π.
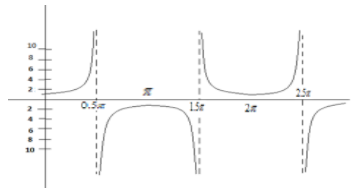
Additional information:
If we compare the graph of cosine and secant we can say that if the graph of cosine function decreases then the graph of secant function increases, similarly if the graph of cosine function increases the graph of secant function decreases. And if the cosine function is zero then the secant function will be undefined. From this we can also conclude that, because cosine is an even function, secant will also be an even function.
Note: Students should draw a proper and neat graph in accordance with the values of secx.The secant is defined as a reciprocal of cosine. The secant function is undefined when the cosine is 0. We know that the cosine will be more than 1 in absolute value. Therefore the secant function will never be less than 1 in absolute value