Question
Question: How will you graph \[g(x) = {\left( {\dfrac{5}{8}} \right)^x}\]?...
How will you graph g(x)=(85)x?
Solution
In order for solving the above problem we can substitute y forg(x). Here we are asked to draw the graph of g(x)=(85)xand we are aware that exponential functions have horizontal asymptote which is basically a line on a graph that is approached by a curve but never reached. Remember that y=0 is the equation of horizontal asymptote.
Formula used:
Substituting y for g(x), then determining the point and later on sketching the curve though the points by plotting it will give the graph
Complete step by step solution:
Firstly we will substitute y for g(x) which means
y=(85)x
Now we will determine the points which includes substituting the value of x including positive and negative numbers both and then solve for y
Later on we will plot the points and sketch a curve through the point
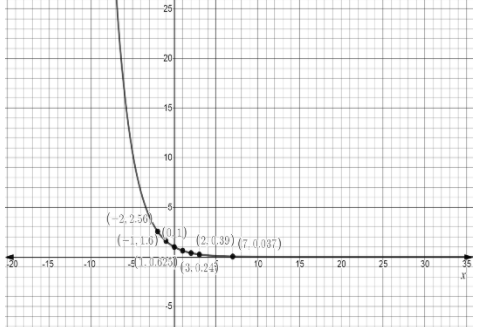
So graph for y=(85)x[−10,10,−5,5]
Using the above information we can plot a graph as followed
Additional Information:
Keep in mind that a horizontal asymptote is technically limited (x=∞or x=−∞) and due to this end behavior of function is measured by it. The graph of the function includes all the values of x and the corresponding values of y that are possible and due to this the graph is a line and not just the dots.
Note:
In the above problem we need to determine the points on the line then we need to plot the points and later on a sketch is curved throughout the point. Keep in mind of not connecting the dots. Exponential functions have horizontal asymptote and the equation of this horizontal asymptote is y=0. Keep in mind that while graphing a function the most significant and helpful step is to make a table of values and inclusion of negative value, positive value and zero for ensuring that we have a linear function is a good idea.