Question
Question: How to plot points for half life graphs?...
How to plot points for half life graphs?
Solution
The half life graph is plotted for a radioactive substance. The time taken by a radioactive substance to decay to half of its amount is known as its half life. It is a constant quantity and in order to plot its graph, time is the independent variable and amount of substance is the dependent variable.
Complete answer:
The half life of a radioactive substance is the time taken by it to decompose to half of its amount. It is given by-
t1/2=λln(2)
Here, t1/2 is the half life
λ is the decay constant of the substance
The half life of a substance is a constant quantity, therefore, for the amount at a specific time it would take time equal to half life to decompose to half its value. In order to plot a graph for the half life of a substance, we take the amount of the substance on the y-axis and the time will be taken on the x-axis as time is the independent variable and amount of substance is the independent variable.
Let us assume at the amount of a substance is x, then it decomposes to 2x in time t1/2.So, the first points are (x,0) and (2x,t1/2). Now the amount of substance is 2x and it will reduce to its half in the next half life, so the next point will be (4x,2t1/2) and plotting all points similarly, we will get an exponential graph.
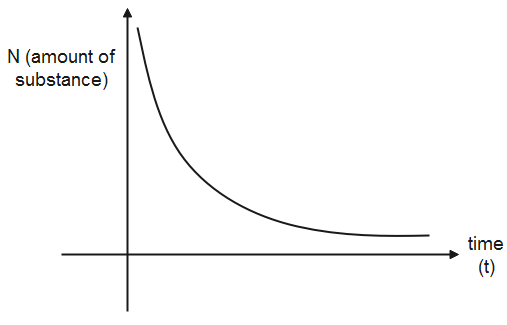
Therefore, when the half life points are plotted, it gives an exponential graph.
Note:
The decay constant is the probability of decay of a radioactive substance in unit time. The mean half life is the average time that a radioactive substance will take to completely disappear. The rate of decay is directly proportional to the number of atoms of the amount present at a specific time.