Question
Question: How to graph a parabola \(y = - 3{\left( {x - 2} \right)^2} + 5\)?...
How to graph a parabola y=−3(x−2)2+5?
Solution
Here, we will compare the given equation with the general equation of parabola to find the vertex. Then we will find x and y intercepts and also an additional point by substituting different values of the variables in the vertex form of the given equation. Using this we will plot those points on a graph and join them together to find the required graph of the given parabola.
Complete step by step solution:
The given quadratic equation in vertex form is y=−3(x−2)2+5
Comparing this with y=a(x−h)2+k, where a is the axis of symmetry and (h,k) is the vertex.
Now, in order to graph a parabola of this quadratic equation, first of all, we will find the vertex.
Now, since, according to the question, a=−3<0 therefore, the vertex will be at the maximum point and the parabola will open downwards.
Thus, comparing the given equation with the general equation, we have,
Vertex (h,k)=(2,5)
Now, substituting x=0 in the given quadratic equation y=−3(x−2)2+5, we get,
y=−3(0−2)2+5
⇒y=−3×4+5=−12+5=−7
Hence, when x=0, y=−7.
Therefore, the y-intercept is (0,−7)
Similarly, substituting y=0 in the given quadratic equation y=−3(x−2)2+5, we get,
0=−3(x−2)2+5
⇒3(x−2)2=5
Dividing both sides by 3, we get
⇒(x−2)2=35
Taking square root on both sides, we gt
⇒x−2=±35
Adding 2 on both sides, we get,
⇒x=2±35
Hence, when y=0, x=2+35,2−35
Therefore, the x-intercepts are (2+35,0) and (2−35,0)
If we do the approximate then, the x-intercepts are (≈3.291,0) and (0.709,0)
Now, we will find an additional point also.
Thus, let x=4
Hence, we get,
y=−3(4−2)2+5
⇒y=−3×4+5=−12+5=−7
Hence, additional point is (4,−7)
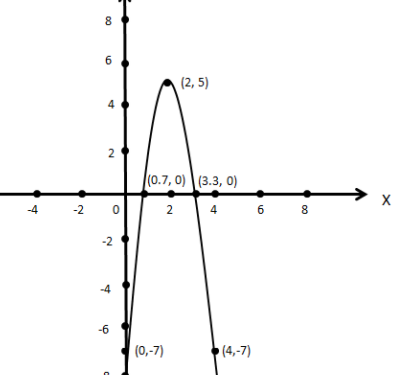
Now, we will draw the graph of parabola, such that,
Its vertex is (2,5)
The x-intercepts are (≈3.291,0) and (0.709,0)
The y-intercept is (0,−7)
An additional point is (4,−7)
Hence, the required graph is:
Hence, this is the required answer.
Note:
A parabola is a curve having a focus and a directrix, such that each point on parabola is at equal distance from them. The axis of symmetry of a parabola is a line about which the parabola is symmetrical. When the parabola is vertical, the line of symmetry is vertical. When a quadratic function is graphed in the coordinate plane, the resulting parabola and corresponding axis of symmetry are vertical.