Question
Question: How to draw the graph for function \({\left( {\dfrac{1}{2}} \right)^x} + {\left( {\dfrac{1}{3}} \rig...
How to draw the graph for function (21)x+(31)x=y ?
Solution
A graph of a function f is the set of ordered pairs of x and y that satisfy the given function. The equation of a graph is generally represented as y=f(x), where x and f(x) are real numbers. We substitute the value of x and we determine the value of y and then we mark the points in the graph and we join the points to form the curve of the function. To draw the graph of the given function, we find the coordinates of the points that satisfy the equation of the function.
Complete step by step answer:
Here in this question, we have to plot the graph for the given function (21)x+(31)x=y.
First, we have to find the value of y by using the graph equation (21)x+(31)x=y by substituting different values of x.
So, let us substitute the value of x as 0, 1, and −1.
Now we consider the value of x as 0, the value of y is
⇒y=(21)x+(31)x
⇒y=(21)0+(31)0
Now, we know that any number raised to the power zero has value one. So, we get,
⇒y=1+1
⇒y=2
Now we consider the value of x as 1, the value of y is
⇒y=(21)x+(31)x
⇒y=(21)1+(31)1
Taking LCM of the fractions, we get,
⇒y=63+62
Adding up the terms, we get,
⇒y=65
Now we consider the value of x as −1, the value of y is
⇒y=(21)−1+(31)−1
We know that power −1 means to calculate the inverse of a number. So, we get,
⇒y=2+3
⇒y=5
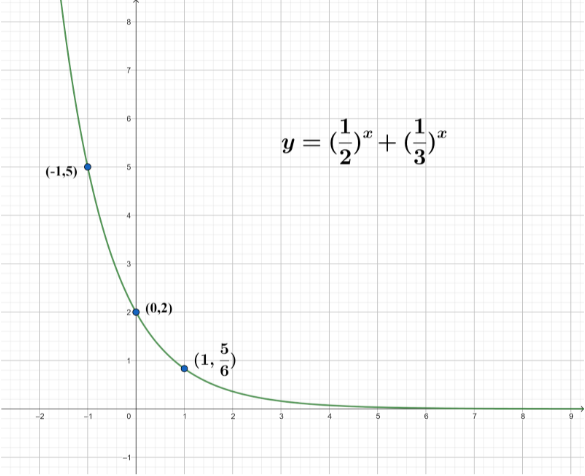
Now we draw a table for these values we have
| x | 0 | 1 | −1 |
|---|---|---|---|
| y | 2 | 65 | 5 |
The graph plotted for these point is represented below:
Note: The graph is plotted in x-axis versus y axis. By the equation of a graph, we can plot the graph by assuming the value of x and finding the corresponding values of y for the function. Then, we mark the points with the given coordinates and trace the curve of function. We must know the substitution of values into a given function for tackling such questions.