Question
Question: How should a scatter plot of data look if there is a positive correlation?...
How should a scatter plot of data look if there is a positive correlation?
Solution
To solve this question we need to know the concept of slope and scatter plot of data. Slope is defined as the “vertical change” to the “horizontal change”. Scatter plot of data is used to present two sets of data. It is important in statistics because it used to show the extent of correlation between the observed quantities.
Complete step-by-step solution:
The question asks us to explain the image of scatter plot of data if the relation between the data is positive. A scatter plot is that type of graph which shows the numerous data plotted as points. The points or you may say data are scattered as per the value given in any problem. It is basically the dependent variable versus the independent variable and is used to investigate whether or not there is a relation between the given two sets of data. Correlation is a statistical method used to determine if there is a connection between the two sets of data.
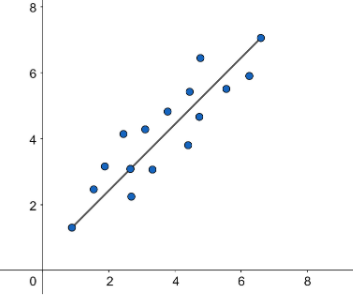
To show the scatter plot of data in any type of correlation we find the slope of the straight line which is formed on joining the scatter plot of data. So to show the scatter plot of data if there is positive correlation the slope will be positive. Slope is the steepness of a line. In positive correlation the points on the scatter plot seem to form a line that slants up from left to right, there is a positive relationship between the variables. The positive graph will be as given below:
Note: The scattered plot of data is correlated majorly in three ways. They are positive correlation, negative correlation and no correlation.
Positive correlation: The slope is positive. The y variable tends to increase as the x variable increases.
Negative correlation: The slope is negative. The y variable tends to decrease as the x variable increases.
No correlation: When there is no clear relationship between the two variables.