Question
Question: How does the graph of the function \[y=3\sqrt{x}\] compare with the graph of the parent square root ...
How does the graph of the function y=3x compare with the graph of the parent square root function?
Solution
Consider y=x as the parent root function. Now, consider some values of x which are perfect squares like 1, 4, 9 and find the value of y for these points. Find the corresponding values of y for the function y=3x. Plot the obtained points and draw the graph of the two functions on the same graph paper to compare them.
Complete step by step answer:
Here, we have been provided with the function y=3x and we are asked to draw its graph and compare it with the graph of parent square root function. But first let us know what is meant by the term ‘parent square root function’.
Now, as we can see that the function y=3x contains 3 as the coefficient of x, so in the parent square root function the coefficient of x will be 1. So, the function would be y=x. To draw the graph we will need some parts, so assuming some values of x which are perfect square, we can draw the following table: -
| x | 1 | 4 | 9 | 16 |
|---|---|---|---|---|
| x | 1 | 2 | 3 | 4 |
| 3x | 3 | 6 | 9 | 12 |
So, drawing the graph of the two functions according to the points obtained, we get,
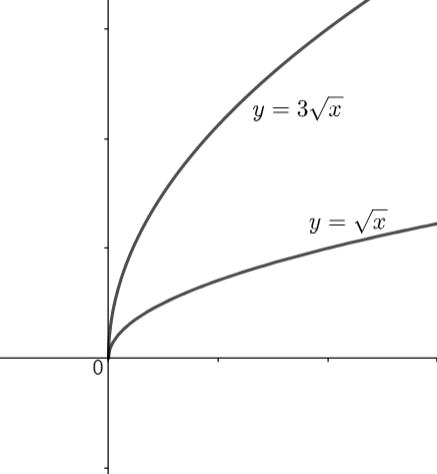
From the above graph we can see that the curve 3x will always be three times the curve x at any particular point x. That means we can say that 3x is stretched three times x. The curve 3x always lies above the curve x.
Note: One may note that the two curves are half part of the parabola having the general equation y2=kx. We have taken only half part because here y will not be negative as we have considered only positive square root and the value of ‘k’ is also positive for both the curves. Remember that you cannot choose negative values of x because if you will do so then the value of x will become imaginary and we do not sketch imaginary values on the cartesian plane. There is another type of plane known as ‘argand plane’ for plotting complex numbers.