Question
Question: How do you use the amplitude and period to graph \(y = 2\sin ( - 2x + \pi ) + 1\)?...
How do you use the amplitude and period to graph y=2sin(−2x+π)+1?
Solution
In this question, we need to plot a graph using the amplitude and period of the given sine function. Firstly, to find the amplitude, period and other things we need to define the general equation of sinx, which is given by y=asin(bx+c)+d. Comparing the given equation with the general equation, we can find out all our required outputs accordingly. Then using these values we plot a required graph.
Complete step by step solution:
Given a function of the form y=2sin(−2x+π)+1 …… (1)
We are asked to plot a graph using the amplitude and period of the above function given in the equation (1).
Note that the above function is sine function, so we write the general equation of sinx as,
y=asin(bx+c)+d …… (2)
In this equation, each and every variable represents some of the output values, which affects the nature of the graph y=2sin(−2x+π)+1.
In the general equation given in equation (2),
a represents the amplitude.
We can find out the period of the given function using the formula of period of sinx which is given by period, P=∣b∣2π.
The horizontal phase shift or phase shift is b−c and d represents the vertical phase shift.
Now comparing the given equation with the general equation, we get,
Amplitude of the function is, a=2.
We find the period of the function by P=∣b∣2π
Here b=−2
Hence we get,
P=∣−2∣2π
⇒P=22π
⇒P=π
We can conclude that the value of the phase shift =b−c
Here c=π and b=−2
⇒−2−π
⇒2π
Vertical shift is, d=1.
To plot the graph we given values for x in the equation (1) and find the values for y.
For x=0, we have,
y=2sin(−2(0)+π)+1
⇒2sin(0+π)+1
⇒2sin(π)+1
⇒2(0)+1=1
For x=4π, we have,
y=2sin(−2(4π)+π)+1
⇒2sin(−2π+π)+1
⇒2sin(2π)+1
⇒2(1)+1=3
For x=−4π, we have,
y=2sin(−2(−4π)+π)+1
⇒2sin(2π+π)+1
⇒2sin(23π)+1
⇒2(−1)+1=−1
For x=43π, we have,
y=2sin(−2(43π)+π)+1
⇒2sin(−23π+π)+1
⇒2sin(2−π)+1
⇒2(−1)+1=−1
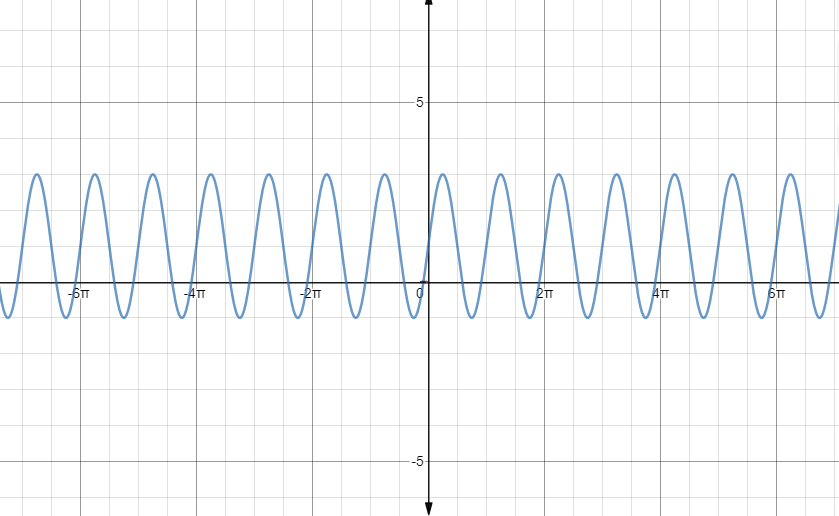
Therefore the points are (0,1), (4π,3), (−4π,−1), (43π,−1).
These points are sufficient to plot the graph.
Note: While solving these types of problems, we must be careful in representing the general form of the equation properly. After the general form is represented correctly, we can find all the necessary things by comparing the given equation with the general form. We also need to remember all the variables and parameters and what variables represents.
The general equation for the function sinx is given by,
y=asin(bx+c)+d
where a represents the amplitude.
The period of the given function using the formula of period of sinxwhich is given by, P=∣b∣2π.
The phase shift is given by b−c and d represents the vertical phase shift.