Question
Question: How do you use end behaviour, zeroes, y intercepts to sketch the graph of \( f\left( x \right)=\left...
How do you use end behaviour, zeroes, y intercepts to sketch the graph of f(x)=(x−4)(x−1)(x+3) ?
Solution
Hint : We first find the intercepts of the given function f(x)=(x−4)(x−1)(x+3) which also gives us the roots of the function. Then we use the differentiation to find the extremum points of the function and draw the graph.
Complete step-by-step answer :
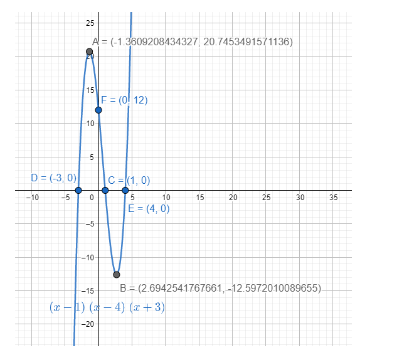
We need to find the zeros, y intercepts of the curve f(x)=(x−4)(x−1)(x+3) .
Here the zeroes mean the x intercepts or the roots of the polynomial.
We put the value of f(x)=0 and get (x−4)(x−1)(x+3)=0 which gives the roots as
x=−3,1,4 . The points are (−3,0),(1,0),(4,0) .
To find the y intercepts we put the value of x=0 and get f(x)=(0−4)(0−1)(0+3)=12 which gives the value as the intersecting point of (0,12) .
Therefore, to find the extremum points we have to find the first and second order derivatives.
Extremum points in a curve have slope value 0.
The slope of the function f(x)=(x−4)(x−1)(x+3) can be found from the derivative of the function f′(x)=dxd[f(x)] .
We differentiate both sides of the function f(x)=(x−4)(x−1)(x+3) with respect to x .
f(x)=(x−4)(x−1)(x+3)=x3−2x2−11x+12⇒f′(x)=dxd[f(x)]=3x2−4x−11 .
To find the x coordinates of the extremum point we take 3x2−4x−11=0 .
In the given equation we have 3x2−4x−11=0 . The values of a,b,c is 3,−4,−11 respectively.
We put the values and get x as x=2×34±42−4×3×(−11)=64±148=32±37 .
Therefore, from the value of the x coordinates of the extremum points, we find their y coordinates.
Therefore, the extremum points are x=32±37 .
Note : We need to remember that the curve changes its direction on the extremum points only. Other that that the function f(x)=(x−4)(x−1)(x+3) is an increasing function in the range of x∈[4,∞) and decreasing function in the range of x∈(−∞,−3] .