Question
Question: How do you use a graphing calculator to find the limit of the sequence \[{a_n} = {\left( {\dfrac{1}{...
How do you use a graphing calculator to find the limit of the sequence an=(21)n ?
Solution
Hint : Here the given question based on geometric series. We have to plot a graph of the given function of the series. Firstly, we have to make a sequence of series by giving a n values, where n belongs to integers i.e., n∈I . After that plot a graph by taking n values in x-axis and an values in y-axis.
Complete step by step solution:
A geometric series is also termed as the geometric progression. It is a series formed by multiplying the first term by a fixed value to get the second term. This process is continued until we get a required number of terms in the series. Such a progression increases in a specific way and hence giving a geometric progression.
Consider, the given limit of the sequence:
⇒an=(21)n where n∈I .
Now giving the n values … -3, -2, -1, 0, 1, 2, 3, … to the above equation simultaneously we get the values of an .
Now put n=−3 , then
⇒a−3=(21)−3
⇒a−3=2−31
⇒a−3=23=8
Put n=−2 , then
⇒a−2=(21)−2
⇒a−2=22=4
Put n=−1 , then
⇒a−1=(21)−1
⇒a−1=21=2
Put n=0 , then
⇒a0=(21)0
⇒a0=1
Put n=1 , then
⇒a1=(21)1
⇒a1=0.5
Put n=2 , then
⇒a2=(21)2
⇒a2=221=41
⇒a2=0.25
Put n=3 , then
⇒a3=(21)3
⇒a3=231=81
⇒a3=0.125
And so on…
Hence the sequence an as written as:
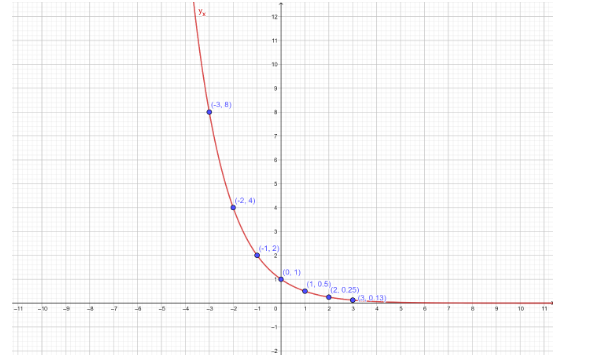
⇒an=⋅⋅⋅,8,4,2,1,0.5,0.25,0.125,⋅⋅⋅
Now, we can plot the graph of an=(21)n , by taking n values in x-axis and an values in y-axis.
Note: The question is belonging to the concept of graph. To plot a graph first we have to choose which one is x-axis and y-axis. Or by choosing the value of x we can determine the value of y and then plotting the graphs for these points we obtain the result.