Question
Question: How do you use a graph to solve an equation on the interval?...
How do you use a graph to solve an equation on the interval?
Solution
Hint : The given question is asked how we solve an equation by using a graph on the given interval. This question is asking the general format for solving an equation with the help of a graph. So let us explain the step by process to solve an equation on the interval only by using a graph and also with an example.
Complete step-by-step answer :
To solve an equation by using a graph on the given interval follow the steps given below:
Step 1: For a given equation on interval find the function y corresponding to the equation.
Step 2: Draw the table for different values of x.
Step 3: Graph the function y, for the values on the table above.
Step 4: Observe the graph and note the points for the given equation. Those points are the solution for the given equation.
Let us consider an equation tan(x)=1 on an interval [−2π,2π].
Step 1: Find the function y,
Given that tan(x)=1, then the function y=tan(x)−1.
Step 2: Draw the table for different values of x.
On the given interval assign the different values for x and thus find y=tan(x)−1.
Given interval [−2π,2π], the values between these interval are: −2π,4−5π,43π and 2π.
Now, x=−2π⇒y=tan(−2π)−1
tan(−2π)=0, by substituting this value,
y=0−1
y=−1
x=4−5π⇒y=tan(4−5π)−1
Substituting the value tan(4−5π)=−1,
y=−1−1
y=−2.
x=43π⇒y=tan(43π)−1
We know that tan(43π)=−1,
y=−1−1
y=−2.
x=2π⇒y=tan(2π)−1
Substitute tan(2π)=0,
y=0−1
y=−1
Now draw the table for the values we found.
| x | y=tan(x)−1 | (x,y) |
|---|---|---|
| −2π | y=tan(−2π)−1 | (−2π,−1) |
| 4−5π | y=tan(4−5π)−1 | (4−5π,−2) |
| 43π | y=tan(43π)−1 | (43π,−2) |
| 2π | y=tan(2π)−1 | (2π,−1) |
Step 3: Graph the function y=tan(x)−1
Draw the coordinate plane and plot the points we found for the table and connect the points.
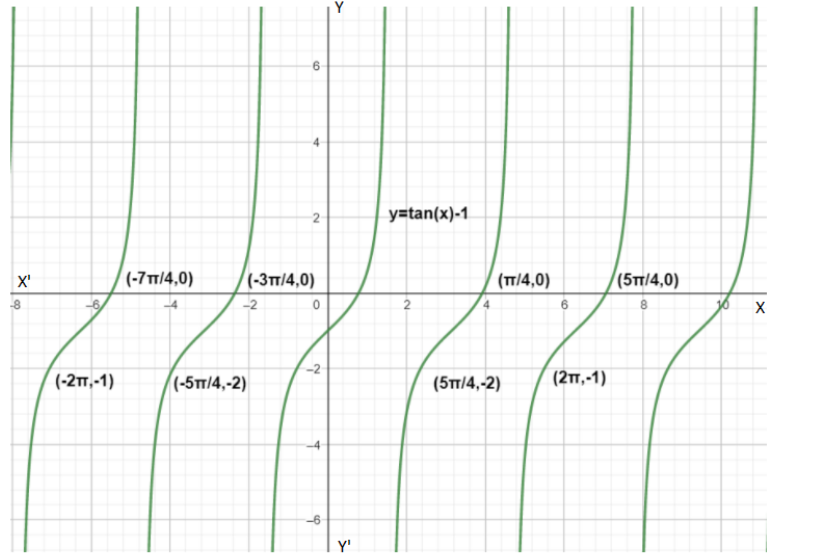
Step 4: Now, observe the graph, the solutions for tan(x)=1 on interval [−2π,2π] are (4−7π,4−3π,4π45π).
Hence we got the solution of tan(x)=1 on an interval [−2π,2π] by using a graph.
Note : To plot a graph it is necessary to have both x value and y value to mark on x-axis and y- axis. Therefore convert the equation into function to obtain two points. And also be very careful while converting the equation into function. And then note the points in a form of table to identify them easily. The equation can also be solved manually by using a set of equations and formulas.