Question
Question: How do you translate the graph of \( y = \sin x - 2 \) ?...
How do you translate the graph of y=sinx−2 ?
Solution
Hint : In order to graph the above trigonometric function, first draw the graph of the sine function. Use the fact that there is a number in the end of sine function, then there will always be a Vertical shift. If the number is positive, then Vertical Shift Up Else Vertical Shift Down. In our case the number is −2 so there is Vertical Shift down two units.
Complete step-by-step answer :
We are given a trigonometric function i.e. y=sinx−2
Recall that the domain of sine function is in the interval [−2π,2π] and the range of the same is in the interval [−1,1] .
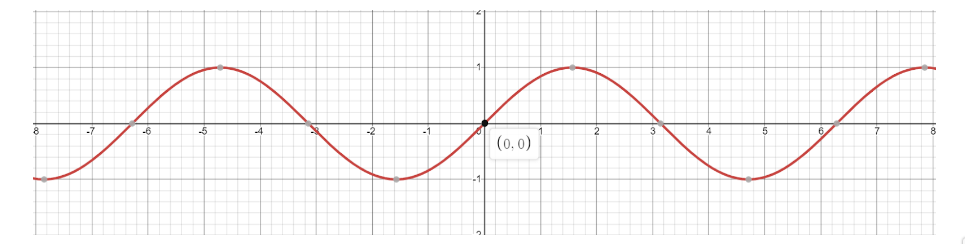
Lets first draw the graph of sine function y=sinx
If you add any number on the end of the sine function, then there will always be a vertical shift of the graph. When the number is positive then there will be a vertical Shift up and if the number is negative then Vertical shift down.
In our case, the number is negative i.e. 2 so the graph will have a Vertical Shift down two units, which gives the following graph :
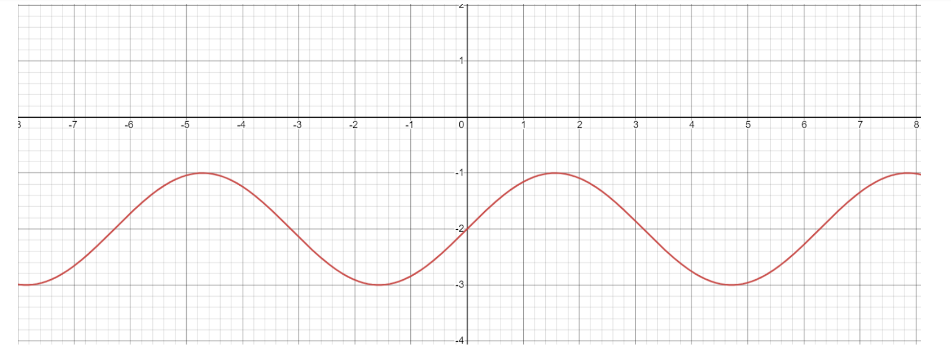
Hence, we’ve successfully plotted our graph of equation y=sinx−2
Note : 1.Draw the cartesian plane only with the help of straight ruler and pencil to get the perfect and accurate results.
2.Mark the points carefully.
3. x-intercept is the point at which the line intersects the x-axis of the plane and similarly y-intercept is the point at which line intersects the y-axis of the plane.
4. Before solving such types of problems , first check whether there is a vertical shift or horizontal shift. Horizontal shift is when some value is added or subtracted from the x variable. For example y=sin(x±c) .If it is negative then there will be a right horizontal shift and when it is positive then left-horizontal shift .