Question
Question: How do you translate the graph of \(y = \sin \left( {x - \dfrac{\pi }{3}} \right)\)?...
How do you translate the graph of y=sin(x−3π)?
Solution
We will write the given equation in the general format of the equation, and find the various parameters such as baseline, amplitude, and shift to plot the graph of the given equation.
Formula used: y=asin(bx+c)+d
Where a is the amplitude of the equation which tells us the maximum and the minimum value the graph would go from the baseline value,
b is the period of the graph,
c depicts the shift of the equation, positive shift represents that the graph is shifted towards the left and negative shift represents the graph shifting to right.
And d is the baseline of the equation which tells us whether the graph is going upwards or downwards.
Complete step-by-step solution:
We have the given equation as:
y=sin(x−3π) which is a regular y=sinx graph but which is shifted to the right by 3π units.
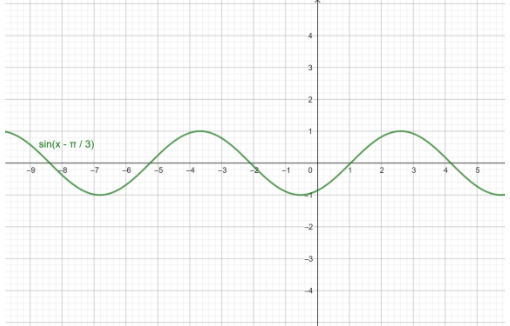
Now the amplitude of the above equation is 1 and the baseline is 0, therefore the graph has maximum and minimum values in the y coordinate as −1 and 1.
Now the starting point in a general y=sinx graph is 0, but since this is a shifted graph, we find the starting point as:
⇒x−3π=0, therefore x=3πis the starting point.
Now the period is found out as: a2π
On substituting we get:
period=12π=2π
Therefore, now we can write the final graph of y=sin(x−3π) is the same graph of y=sinx, but it just starts from the point 3π from the x axis instead of 0.
Note: The definition of translation is changing of position in a two-dimensional space.
The sign of the shift c represents in which direction the shift is taking place, it could be negative or positive for right and left respectively.