Question
Question: How do you solve and graph the inequality \(6x + 5 \geqslant 7x\) ?...
How do you solve and graph the inequality 6x+5⩾7x ?
Solution
In the given question, we have to solve and plot the graph of the inequality given to us in the problem. We can solve the inequality using the simple algebraic rules of simplification and transposition rule. Then, we can plot the simplified form of the inequality obtained.
Complete step by step solution:
Here in this question, the inequality provided to us is 6x+5⩾7x .
Now, we shift all the terms consisting of x to the right side of the question. So, we get,
⇒5⩾7x−6x
Simplifying the inequality further, we get,
⇒x⩽5
Hence, the solution of the inequality 6x+5⩾7x are all the real values of x less than or equal to 5.
So, the simplified form of the inequality 6x+5⩾7x is x⩽5 obtained by using the transposition and algebraic simplification rules.
Now, we have to graph the inequality 6x+5⩾7x. To graph the original inequality 6x+5⩾7x, we can graph the inequality obtained after simplifying the inequality using the transposition rule x⩽5.
So, to plot the graph of an inequality, we have to first sketch the graph of the line obtained by replacing the inequality sign by “equals to sign.” Then, the line divides the Cartesian plane into two halves. We put coordinates of the points from both the regions and points from whichever region satisfies the inequality, that region represents the graph of the inequality.
So, we replace the inequality sign in inequality x⩽5 with an “equals to” sign so as to get the equation of a line.
So, we get the equation of the line as x=5.
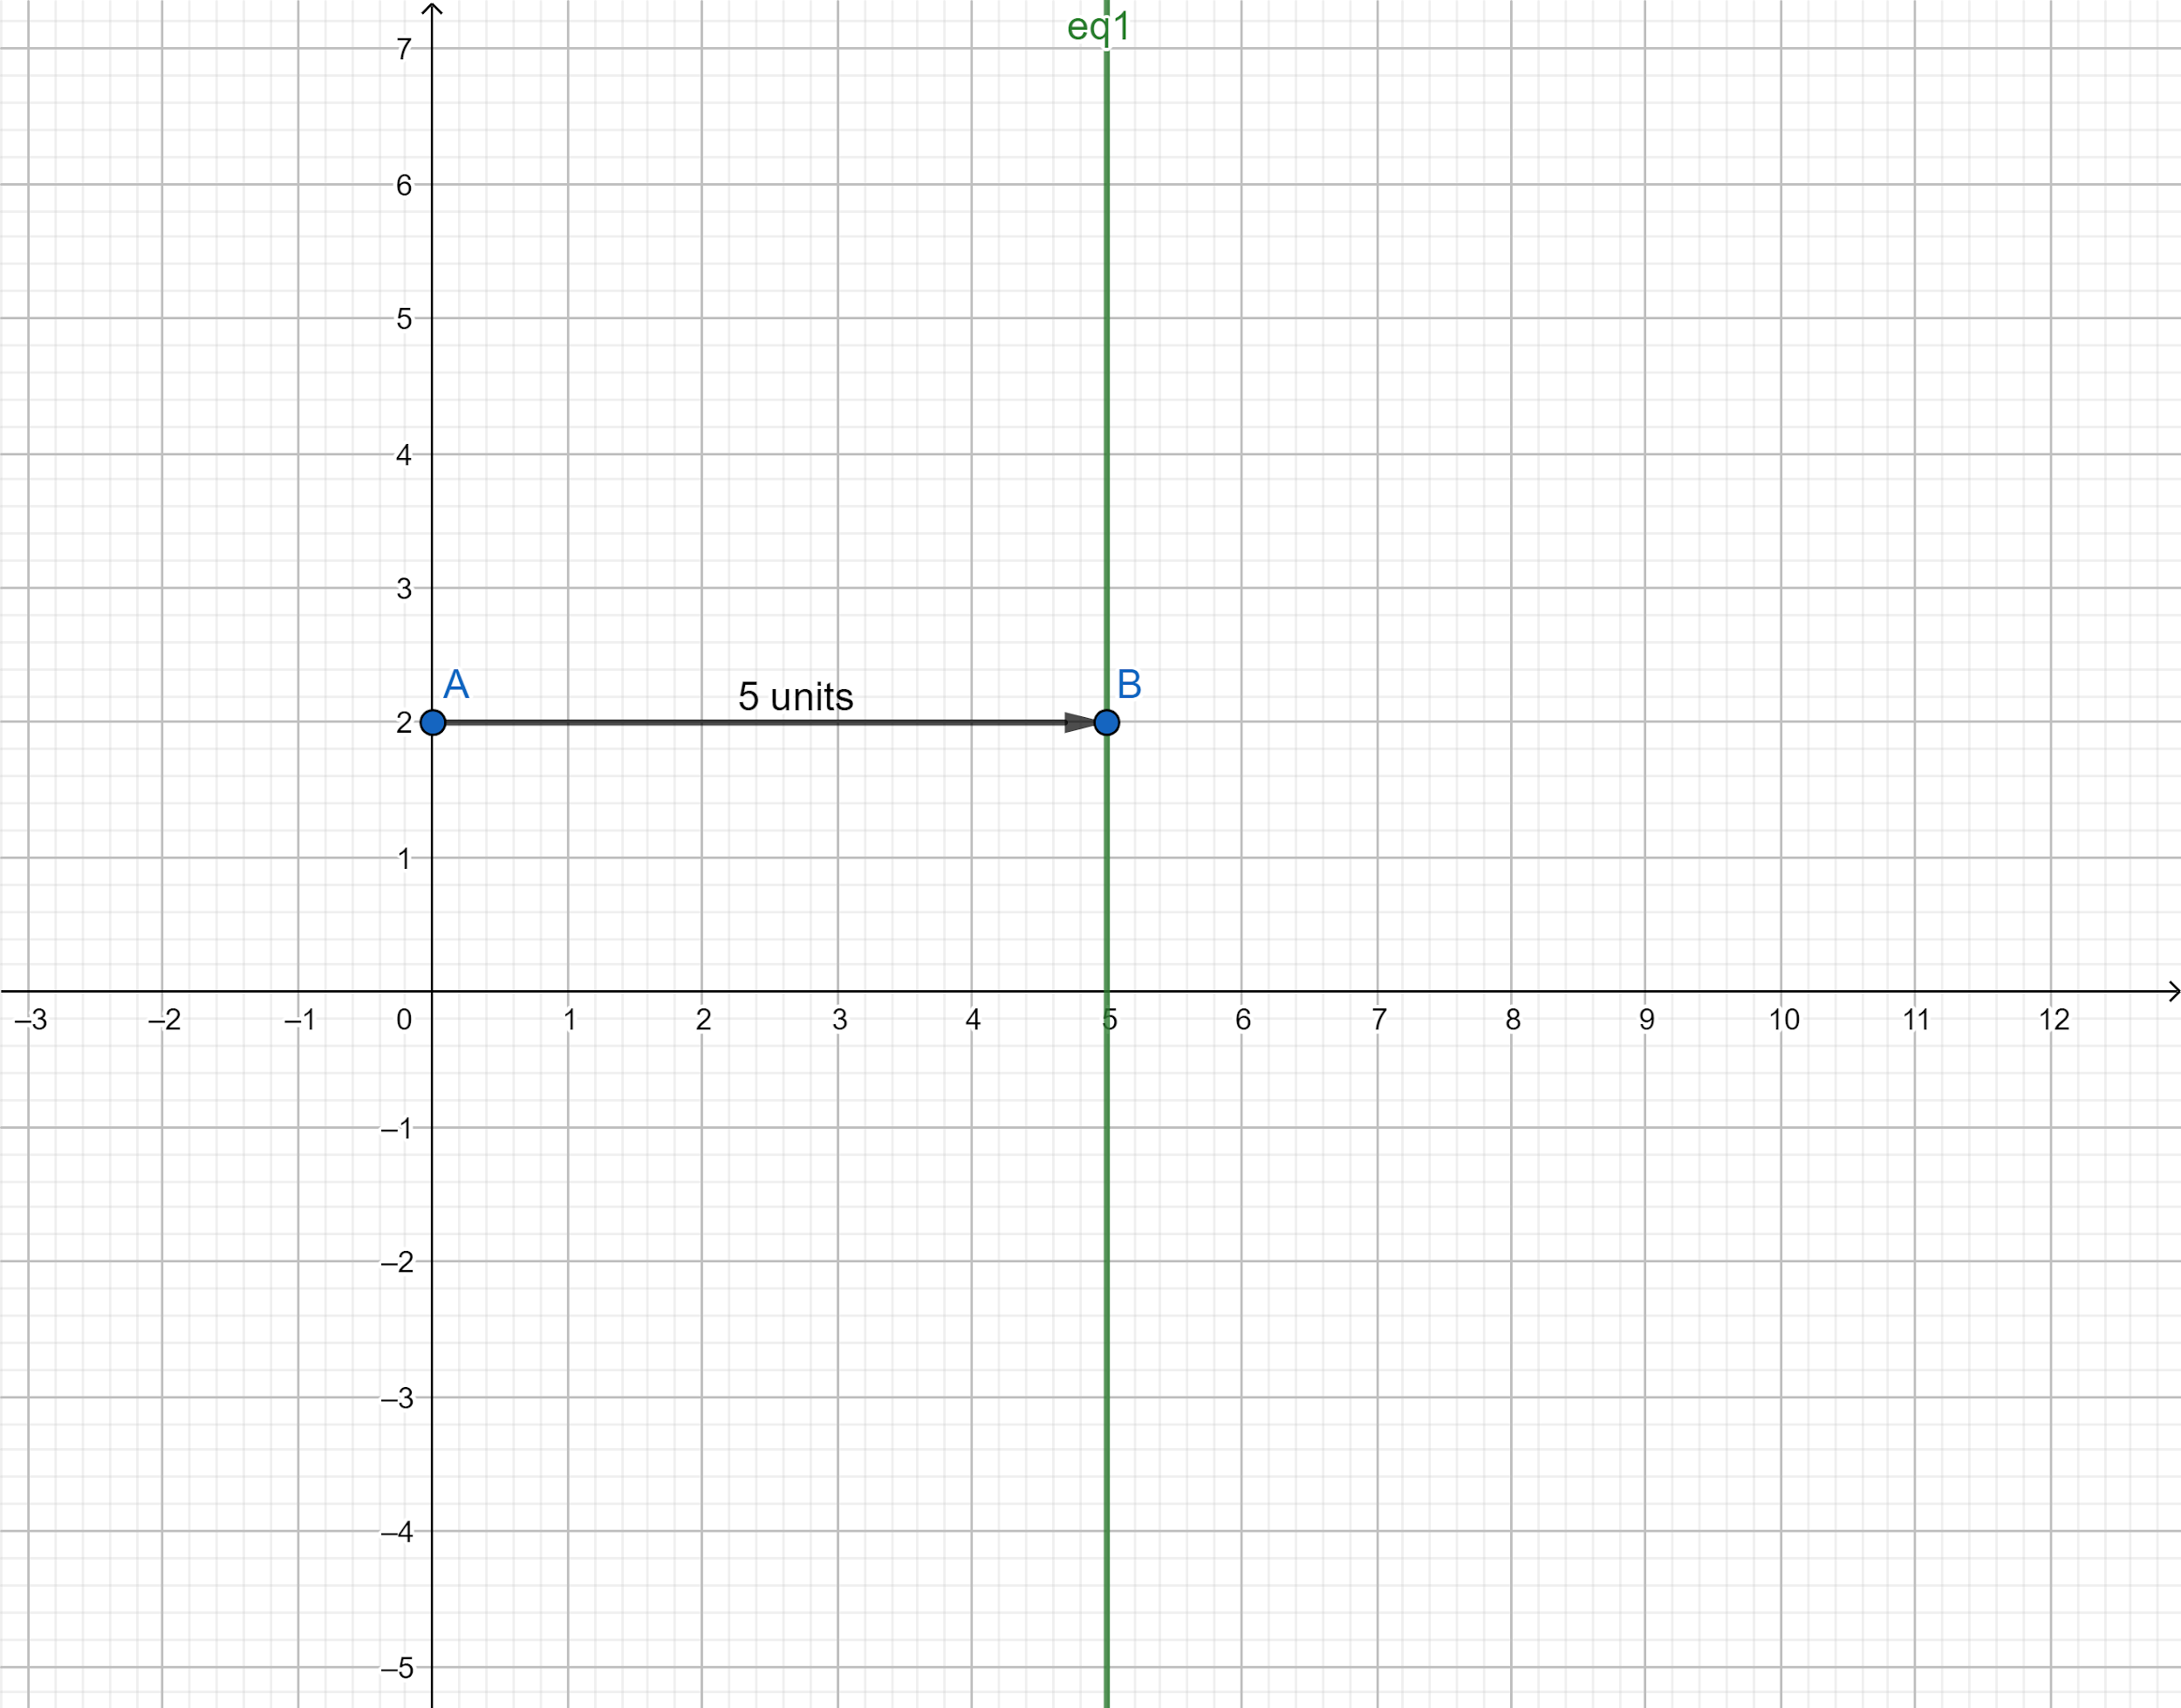
Hence, now we draw the graph of the line x=5. The line represented by the equation x=5 is parallel to the y-axis and is at a distance of 5 units from the y-axis.
Hence, the graph plotted for the obtained line is represented below:
We know that a line divides the Cartesian plane into two halves. After drawing the graph of the line, we choose which half represents the inequality given to us in the problem. We substitute the coordinates of one point lying in both the regions and the region consisting of the point that satisfies the inequality is the graph of that inequality.
So, we substitute the coordinates of the origin in the inequality 6x+5⩾7x.
So, we get,
⇒6(0)+5⩾7(0)
⇒5⩾0
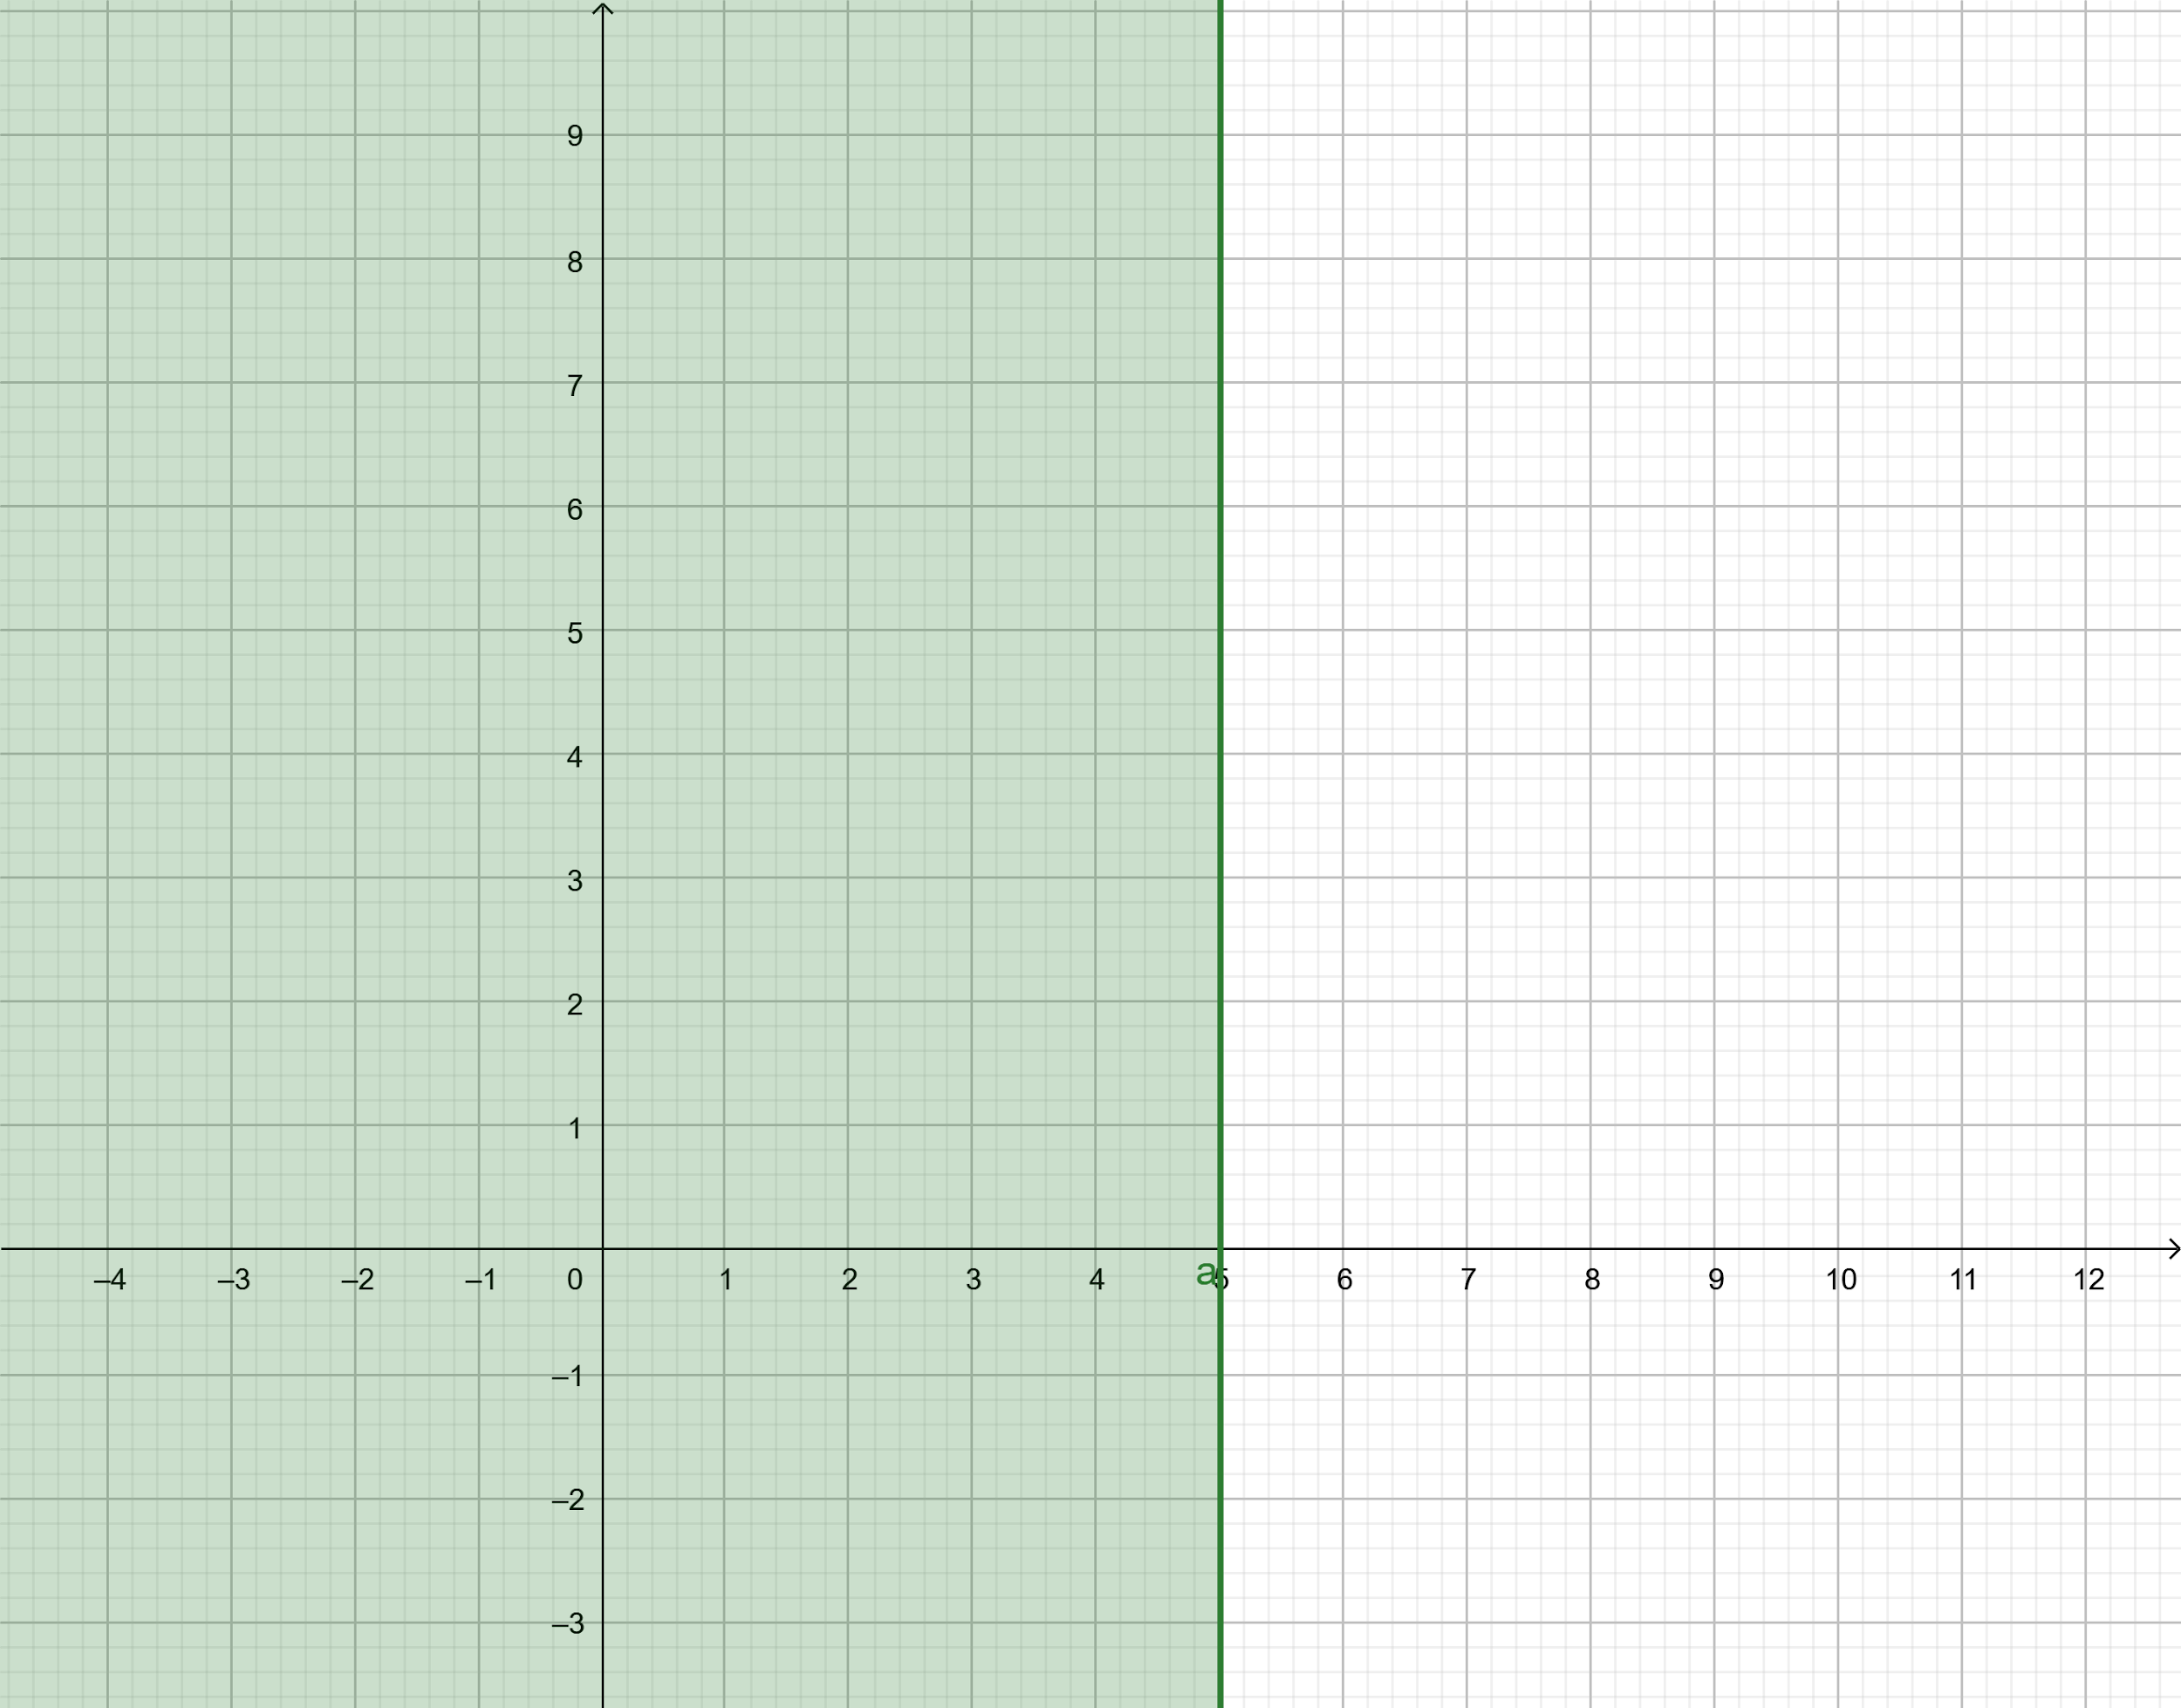
We know that the above expression is true. Hence, the coordinates of origin satisfy the given inequality.
Hence, the graph of the inequality consists of the region consisting of the origin. So, we get the graph of the inequality as:
Note:
The graph plotted is a two dimensional graph in x-axis versus y-axis. This is the easiest way of solving such a question and the solution can be referred whenever one needs to do any other question of the same type.