Question
Question: How do you sketch the region enclosed by \(y = x + 1\), \(y = 9 - {x^2}\), \(x = - 1\)and \(x = 2\)a...
How do you sketch the region enclosed by y=x+1, y=9−x2, x=−1and x=2and find the area?
Solution
Hint : To solve this question, first we need to plot the given functions on the graph. After that we can see which function is above or below between the first two functions. According to their position, we will subtract one from the other and apply the given boundary conditions and do the integration to find the required area.
Complete step-by-step answer :
We know that y=x+1 is the equation of straight line, y=9−x2 is the equation of parabola, x=−1and x=2 are the equations of two vertical lines.
Thus, if we plot these on the graph, we get:
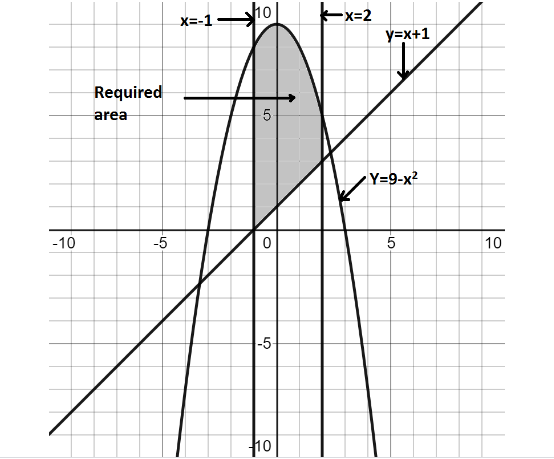
As we can see, the shaded area is our required area.
Now, it is clearly observed that parabola y=9−x2 is above the line y=x+1. Therefore we need to subtract y=x+1 from y=9−x2 and integrate between the two boundary lines x=−1 and x=2which will give us the value of the enclosed area.
Let us consider the enclosed area as A.
Therefore, it can be given by:
Thus, our final answer is:
The area enclosed by the given curves is 239unit2.
So, the correct answer is “239unit2.”.
Note : Here, we have used the integration to find the area under the curve. Basically, we have considered the area as the collection of small vertical strips. The limit of this vertical strips is given as two vertical lines. Thus, we have calculated the area enclosed by the curves by using the simple definition of integration by considering two vertical boundaries of the area.