Question
Question: How do you sketch the graphs of \(y=2{{\left( x-3 \right)}^{2}}+4\) and describe the transformation?...
How do you sketch the graphs of y=2(x−3)2+4 and describe the transformation?
Solution
Now we are given with an equation of the form y=a(x−h)2+k . Now we know that if a > 0 then the parabola is upward facing and (h, k) is the vertex of parabola. Now we will plot some points on the graph and plot the required parabola on the graph.
Complete step by step solution:
Now consider the given equation y=2(x−3)2+4
Now the given equation is an equation of the form y=a(x−h)2+k
Now we know that this is an equation of a parabola.
Now for the parabola y=a(x−h)2+k we have (h,k) is the vertex of the parabola.
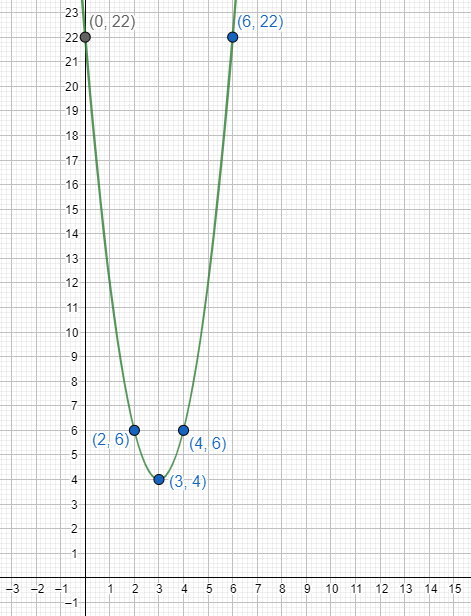
Hence we can say that (3, 4) is the vertex of parabola.
Now since a > 0 the parabola is upwards facing.
Hence we have the parabola y=2(x−3)2+4 is an upward facing parabola with vertex (3, 4)
Now also we know that the axis of parabola will be along x = 3.
Now let us try to plot some points of parabola.
On substituting x = 0 in the equation we get.
⇒y=2(−3)2+4⇒y=18+4⇒y=22
Now on substituting x = 6 in the equation we get
⇒y=2(6−3)2+4⇒y=2(9)+4⇒y=22
Hence we get (0, 22) and (6, 22) are points on parabola.
Now let x = 2 then we get
⇒y=2(2−3)2+4⇒y=2(−1)2+4⇒y=2+4⇒y=6
Similarly if we substitute x = 4 we get
⇒y=2(−3)2+4⇒y=2(1)2+4⇒y=2+4⇒y=6
Hence (4, 1) and (2, 6) are the points on parabola
Now let us try and plot the graph of parabola passing through the given points.
Note: Now note that while selecting points to plot on the graph always select at least 4 points. Also for precise plotting select the points which are on either side of the axis of symmetry. Hence select two points on LHS and two points on RHS. Here we have plotted points such that we get the same value of y for points.