Question
Question: How do you sketch the graph \[y={{x}^{3}}-4{{x}^{2}}\] using the first and second derivatives?...
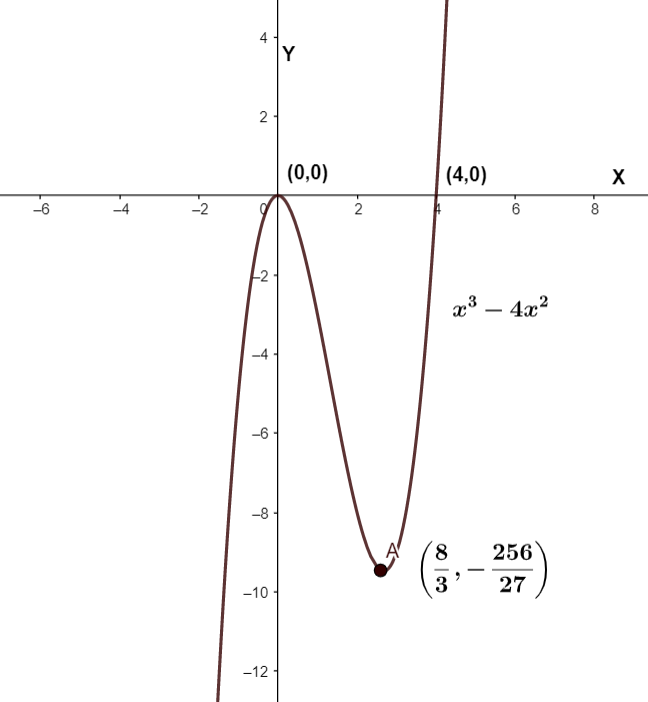
How do you sketch the graph y=x3−4x2 using the first and second derivatives?
Solution
To graph the function using its equation and derivative, we need to follow some steps. First, find the value of the roots that can be found using the equation. Differentiate the function to find the increasing and decreasing intervals for the function. Again, differentiate the function to find the points where the curve is concave upward or concave downward. Using the roots, increasing decreasing intervals, and concavity conditions, we can graph the equation.
Complete step by step solution:
The given equation is y=x3−4x2. We know the steps to follow to graph an equation using its derivatives. First, let’s find the roots of the equation. As the constant term of the equation is zero, one root must be x=0. Factoring the equation, we get y=x(x2−4x). We can factorize this quadratic equation to further factorize equation as y=x2(x−4)
We can say that this cubic equation has three roots, one of them is a repeated root. So together the given equation has two real roots.
Differentiating the equation, we get
dxdy=dxd(x3−4x2)=dxd(x3)−dxd(4x2)
dxdy=3x2−8x
We can easily find the roots of the above quadratic equation as x=0&x=38.
Further factoring the derivative to get second derivative, we get dx2d2y=6x−8. This linear equation has only one real root, x=68=34.
Now, we have the first and second derivative of the function, and their roots. We can use this information to plot the given equation as follows,
Note: The method to graph the function using their first and second derivative is very useful. We can describe the nature of a function in a range by looking at its graph. The graph of the function also tells us about the local and global maxima or minima, also the roots of the function.