Question
Question: How do you sketch the graph \( y = \ln \left( {\dfrac{1}{x}} \right) \) using the first and second d...
How do you sketch the graph y=ln(x1) using the first and second derivatives?
Solution
Hint : Firstly find the domain of the function, and then find the limits of the function at boundaries of the domain. Then find whether the graph is increasing or decreasing with help of its first derivative either positive or negative and then with help of the second derivative find the concavity of the graph that is either concave up or concave down accordingly second derivative is positive or negative. After finding this all, sketch the respective graph.
Complete step-by-step answer :
In order to sketch the graph of the given function y=ln(x1) using first and second derivative, we will first find the domain of the function y=ln(x1)
Since the function y=ln(x1) is consist of only log function, therefore its domain will be x∈(0,∞)
Now we will find range of the function as follows
x→0+limy=x→0+limln(x1)=∞ x→∞limy=x→∞limln(x1)=−∞
So we get range and domain, now we will find out whether the function is increasing or decreasing by finding its first derivative
y=ln(x1) y′=x11(−x21)=−x1
From this we can see that f(x) is monotone and decreasing.
Now finding the concavity of the function with help of second derivative of the function
y=ln(x1) y′′=x21
Since the second derivative is positive therefore, the graph will be concave up.
Now sketching the graph with help of following information
Domain: x∈(0,∞)
Range: y∈(∞,−∞)
Monotonic and decreasing
Concavity: Up
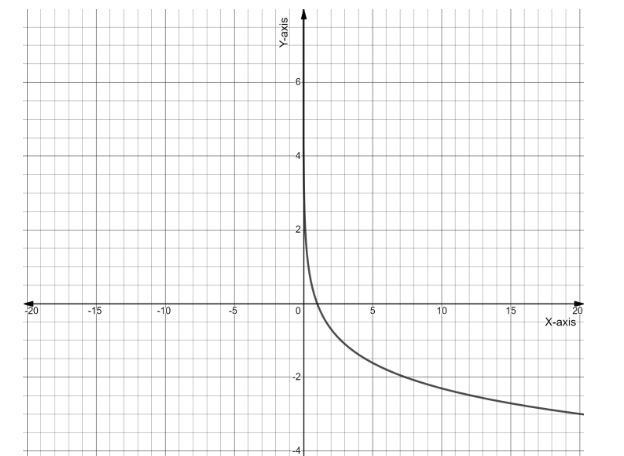
Note : Take care of the point that graph is not touching the y-axis, because as we have defined the domain of the function from zero to positive infinity excluding zero because you can see that at zero the given function is not defined.