Question
Question: How do you sketch the graph of \[y = {x^2} - 5\] and describe the transformation?...
How do you sketch the graph of y=x2−5 and describe the transformation?
Solution
The basic equation of parabola is y=ax2+c, in which the vertical movement along a parabola’s line of symmetry is called a vertical shift. A vertical shift is when the graph literally moves vertically, up or down. As the given equation is a quadratic equation, the graph of a quadratic function is represented using a parabola. Vertex of a quadratic equation is its minimum or lowest point if the parabola is opening upwards or its highest or maximum point if it opens downwards.
Complete step by step solution:
Given,
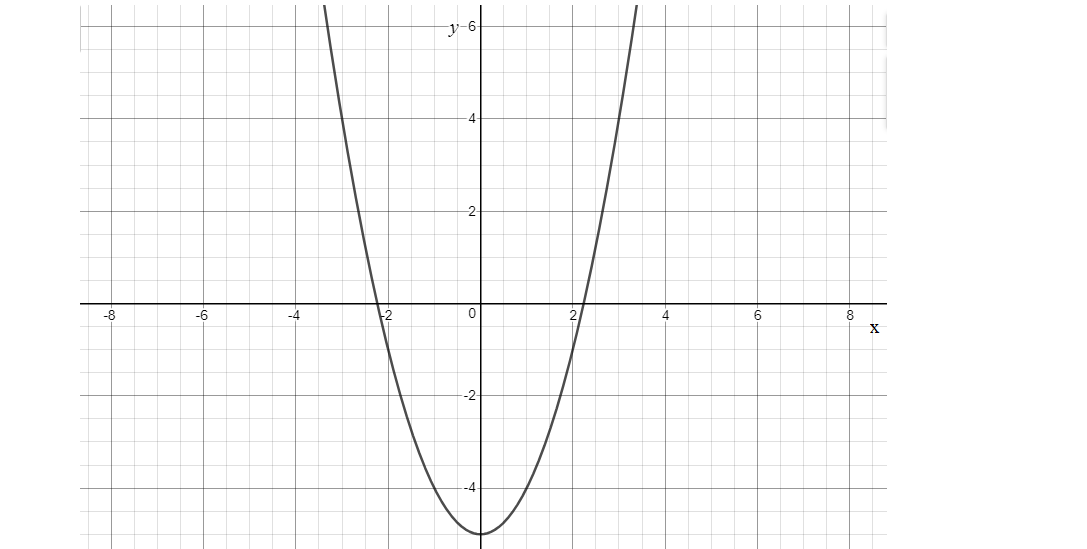
y=x2−5
If you know the graph of a function y=f(x), then you can have four kind of transformations: the most general expression is:
Af(wx+h)+v
Where:
\to $$$$Amultiplies the whole function, thus stretching it vertically (expansion if ∣A∣>1, contraction otherwise)
\to $$$$wmultiplies the input variable, thus stretching it horizontally (expansion if ∣w∣>1, contraction otherwise)
→h and v are, respectively, horizontal and vertical translations.
In this given function, starting from f(x)=x2, you have A=1and w=1. Being multiplicative factors, they have non-effect.
Moreover, h=0. Being ad additive factor, it has non-effect.
Finally, you have v=−5. This means that, if you start from the "standard" parabola f(x)=x2, to describe the transformation going on the graph of f(x)=x2−5 is the same, just translated 5 units down.
The graph is shown as:
Note: We know that the basic equation of parabola is y=ax2+c, here given function we have a=1, if a is positive the parabola opens upwards as a is greater than 1, the parabola is narrow about its line of symmetry. The movement is all based on the y-value of the graph. The y-axis of a coordinate plane is the vertical axis. When a function shifts vertically, the y-value changes. Adding or subtracting a positive constant k to f(x) is called a vertical shift. Adding or subtracting a positive constant h to x is called a horizontal shift.