Question
Question: How do you sketch the graph of \[y = {x^2} - 2x\] and describe the transformation?...
How do you sketch the graph of y=x2−2x and describe the transformation?
Solution
In the given question, we have been given an equation which has to be graphed. For doing that, we set the y-coordinate to be zero. Then we find the value of the abscissa. From there, we find the value of the y-coordinate. Then we graph the points and draw the figure.
Complete step by step solution:
In the given question, we have to graph y=x2−2x.
First, let us find the value of x.
Put y=0,
x2−2x=0⇒x(x−2)=0
Thus, x=0,2.
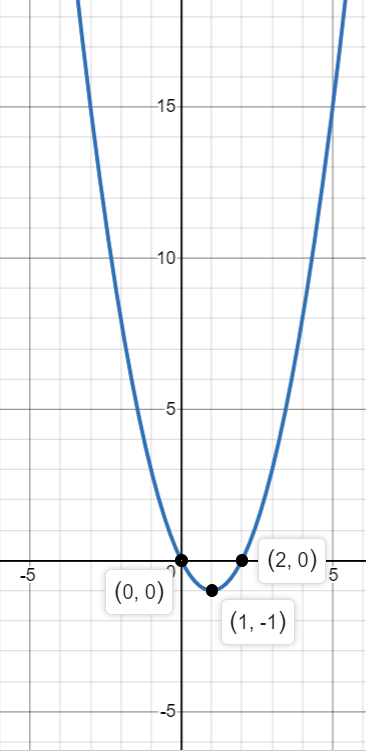
So, we have to x-intercepts – 0 and 2.
Hence, we have two points – (0,0) and (2,0).
Now, we find the local minima so as to get the end point.
First, we find the derivative of y, which is,
y′=2x−2
Putting it equal to 0,
2x−2=0⇒x=1
Now, putting x=1 in the original equation, we have,
y=1−2=−1
Hence, the local minimum point is (1,−1).
Note: In the given question we had to graph a line whose equation was given. Here, the equation was not a linear equation. So, to do that, we found the value of the abscissas, then we obtained the value of y-coordinate and finally, we plot the points on a graph and draw the figure. So, it is important that we know the exact method of how to solve such questions, as following each step correctly is crucial to solve the question.