Question
Question: How do you sketch the graph of \(y={{\log }_{2}}x+3\) ?...
How do you sketch the graph of y=log2x+3 ?
Solution
At first, we convert the base 2 to some standard base like e or 10 using the formula logam=logbalogbm . After that, we perform some basic arithmetic operations and get an equation of the form y=mlnx+c . This can easily be plotted.
Complete step by step solution:
The given equation that we have is,
y=log2x+3....(1)
At first, it may seem easy to plot the graph of the equation. But, if we observe carefully, we see that the base of the logarithm used here is 2 . The standard bases of logarithms that we can plot using a graphing calculator are e and 10 . So, we first need to change the base 2 to some standard base to plot the graph. For this problem, we choose the base e .
Now, we know the formula of logarithms that logam=logbalogbm . In our problem, we need to transform the logarithm log2x so, we have, m=x,a=2,b=e . Thus putting the values in the formula, we get,
⇒log2x=loge2logex
Now, we know that logarithm with base e can be written as ln instead of loge . So, implementing the said in the above equation, we get,
⇒log2x=ln2lnx
Putting the above value of log2x in equation (1) , we get,
⇒y=ln2lnx+3
Multiplying both sides of the above equation by ln2 , we get,
⇒y×ln2=(ln2lnx+3)×ln2
This upon simplification gives,
⇒y×ln2=(lnx+3ln2)
The value of ln2 is 0.693 . Putting this value in the above equation, we get,
⇒y×0.693=lnx+3×0.693
Simplifying, we get,
⇒0.693y=lnx+2.079
Dividing both sides by 0.693 ,
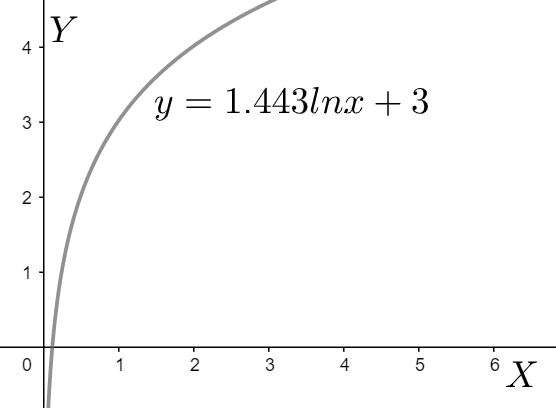
⇒y=1.443lnx+3....(2)
This is of the standard form y=mlnx+c . Thus, the graph is,
Note: We must be careful to notice the base as 2 and should not blindly take it as e or 10 . Also, if we convert the base to 10 or e , we should stick to it. We can also solve by expression equation (2) as x=e1.443y−3 which will also give the same result.