Question
Question: How do you sketch the graph of \(y={{\log }_{2}}\left( x-1 \right)\) ?...
How do you sketch the graph of y=log2(x−1) ?
Solution
If we draw the graph of any function f(x) and shift the graph k units towards right , we will get the graph of f(x- k). If the function f(x) is log2x the value of f(x –k) is equal to log2(x−k). If we assume f(x) as log2x and k as 1, to solve this question we will first draw the graph of log2x and then we will shift the graph 1 unit towards right we will get the graph of y=log2(x−1)
Complete step-by-step answer:
We have to sketch y=log2(x−1)
We can draw the graph of log2x then we will shift the graph of 1 unit towards the right. We will get the graph of y=log2(x−1)
The graph of log2x will be same shape as graph of lnx we can write log2x=ln2lnx
So let’s draw the graph of log2x and shift the graph 1 unit towards right
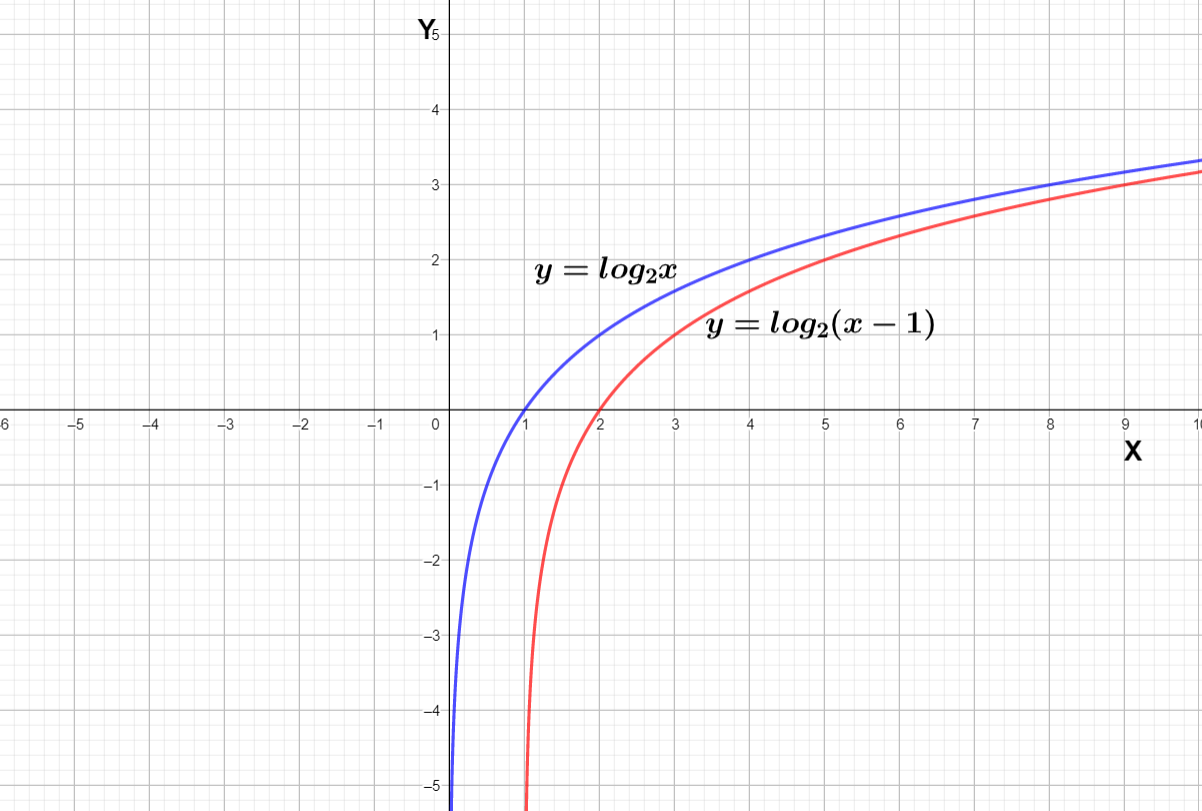
We can see the blue curve is the graph of log2x shifting the curve we get the red curve which is of y=log2(x−1)
Note: We can see the graph of log2x does not exist when x is less equal to 0 that is because the domain of log x includes only positive real numbers . The domain of y=log2(x−1) is from 1 to infinity which does not include 1 because in y=log2(x−1) the value of x – 1 should be positive real number and if we solve x – 1 > 0 we will get the solution x∈(1,∞)