Question
Question: How do you sketch the graph of \[y = {\left( {x - 3} \right)^2}\] and describe the transformation?...
How do you sketch the graph of y=(x−3)2 and describe the transformation?
Solution
Here we have to show the graphical representation of y=(x−3)2 . To do so, our first approach is to find different values of y for the different values of x . Then, we will plot the obtained points on a graph. Therefore we can sketch the graph of y=(x−3)2 by joining all the points with a curved line. Also, in the given equation y=(x−3)2 , the R.H.S. is whole squared which means that y will always be a non-negative number. Therefore, for all values of x , the graph will lie above the x-axis, i.e. in the first and second quadrant.
Complete step by step answer:
Given equation is y=(x−3)2 .
Now we have to find different coordinates which satisfy the equation, i.e. those points which lie on the above curve.
Hence, we will put random values for x and find the related value of y for that x or vice-versa.
Now, putting the value x=0 in the equation y=(x−3)2 ,
We get,
y=(0−3)2
y=(−3)2
Solving the R.H.S., we get
y=9
Therefore, y=9 for x=0 .
Similarly, putting the value y=0 in y=(x−3)2
We get,
0=(x−3)2
Taking square root of both sides,
x−3=0
Adding 3 both sides, we get
x=3
Therefore, x=3 for y=0
Again, putting the value x=4 in the equation y=(x−3)2
We get,
y=(4−3)2
Solving the R.H.S., we get
y=(1)2
or
y=1
Therefore, y=1 for x=4
Now the three obtained points are:
| x | 0 | 3 | 4 |
|---|---|---|---|
| y | 9 | 0 | 1 |
Therefore, the three coordinates that lie on the curve y=(x−3)2 are (0,9) , (3,0) and (4,1) .
Plotting these points on a graph and then extending the curve after joining all the points gives us the graph of y=(x−3)2 .
The obtained graph is shown below:
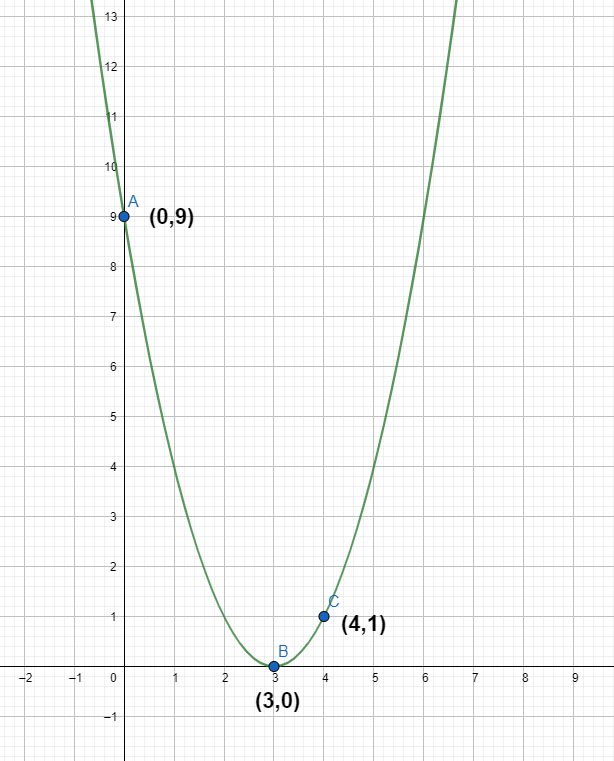
That is the required graphical representation of the equation y=(x−3)2 .
When the equation is given in its particular form as y=(x−a)2 , then the curve is shifted by a units on the x-axis. In that case, the point of contact of the curve and the x-axis is (a,0) . For example, in the above equation y=(x−3)2 , the curve was shifted by 3 units on the x-axis.
Note:
The standard form of such curves is y=x2 . That curve also looks similar to the curve in the above graph but the curve touches the x-axis at the origin (0,0) . The given graph depicts an upward facing parabola touching the x axis at (3,0).