Question
Question: How do you sketch the graph of \[y = {\left( {x + 2} \right)^2}\] and describe the transformation?...
How do you sketch the graph of y=(x+2)2 and describe the transformation?
Solution
In this question we need to find the graph of y=(x+2)2 and determine the transformation for it. To obtain the graph find the value of y for the different value of x and then mark the points on the graph to make the graph. Also to determine the transformation, determine the change in the transformation from parent function to given function.
Complete Step By Step solution:
In this question we have given a function that is y=(x+2)2 and we need to sketch the graph and need to describe the transformation.
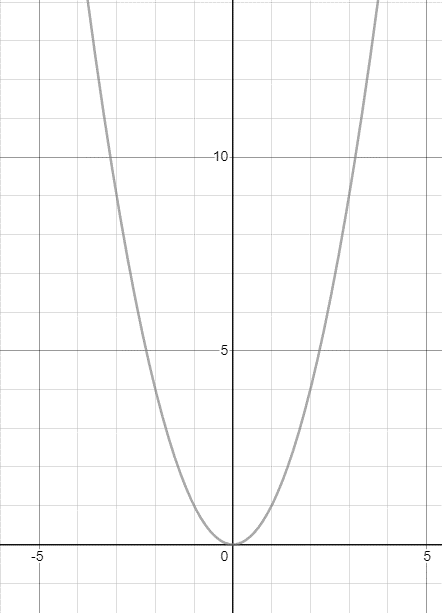
The above function is the quadratic function. The parent function for the quadratic function is y=x2.
Consider the table of values for this parent function is,
| y | x |
|---|---|
| 4 | −2 |
| 9 | −3 |
| 25 | −5 |
| 49 | −7 |
| 64 | −8 |
| 4 | 2 |
| 9 | 3 |
| 25 | 5 |
| 49 | 7 |
| 64 | 8 |
From the above table the graph for the parent function is shown below.
Now we will consider the table of values for this given function is,
| y=(x+2)2 | x |
|---|---|
| 0 | −2 |
| 1 | −3 |
| 9 | −5 |
| 25 | −7 |
| 36 | −8 |
| 16 | 2 |
| 25 | 3 |
| 49 | 5 |
| 81 | 7 |
| 100 | 8 |
From the above table the graph for the given function is shown in figure below.
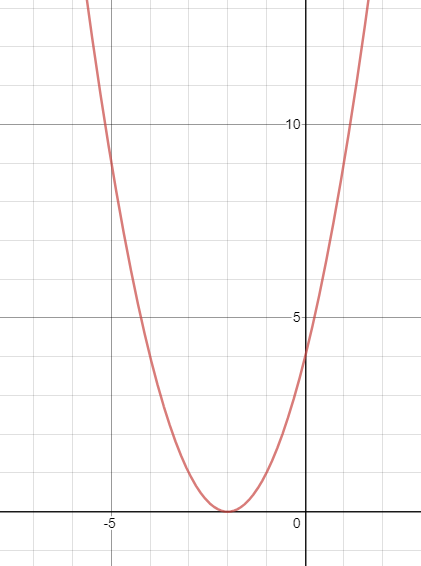
From the graph for the parent function and the graph for the given equation. It is concluded that the graph of (x+2)2 is shifted 2 unit to the left from the parent function x2.
Note:
As we know that the quadratic equation is the equation that is of the standard from ax2+bx+c. Here, a and b are the coefficients and c is the constant. In the general equation the highest power of the x is 2 so the equation is called quadratic. The range of all the quadratic functions lies from −∞ to ∞.