Question
Question: How do you sketch the graph of \( y = \dfrac{1}{2}{x^2} \) and describe the transformation ?...
How do you sketch the graph of y=21x2 and describe the transformation ?
Solution
Hint : A graph of a function f is the set of ordered pairs; the equation of the graph is generally represented as y=f(x) , where x and f(x) are real numbers. We substitute the value of x and we determine the value of y and then we mark the points in the graph and we join the points. The graph for the function y=21x2 can be plotted by using the graphical transformations.
Complete step by step solution:
Here, in the given question, we have to plot the graph for the given function. A graph of a function is a set of ordered pairs and it is represented as y=f(x) , where x and f(x) are real numbers. These pairs are in the cartesian form and the graph is the two-dimensional graph.
First, we have to find the value of y by using the graph equation y=21x2 .
Let us substitute the value of x as 2 .
⇒y=21(2)2
⇒y=21(4)
⇒y=2
Now we consider the value of x as 4 , the value of y is
⇒y=21(4)2
⇒y=21(16)
⇒y=8
Now we consider the value of x as 3 , the value of y is
⇒y=21(3)2
⇒y=21(9)
⇒y=4.5
Now we draw a table for these values we have
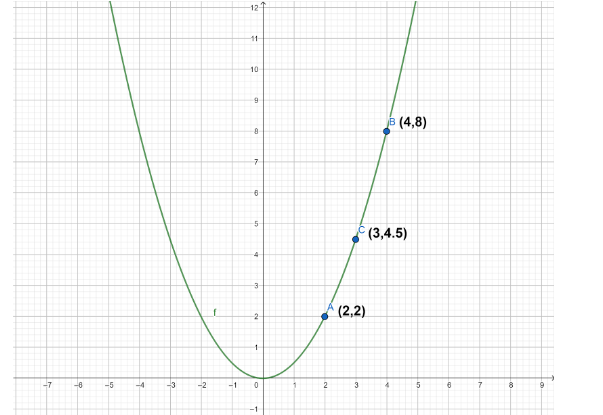
| x | 2 | 4 | 3 |
|---|---|---|---|
| y | 2 | 8 | 4.5 |
We, also know the nature of the graph of square function. Hence, we can now plot the graph of the given function y=21x2 . The graph of the function y=21x2 can also be plotted using the graphical transformation. We know that the graph of y=x2 represents a parabola facing upwards.
So, y=21x2 also represents a parabola facing upwards with a slight vertical compression. So, in comparison to the parent function y=x2 , there is a vertical compression in the graph of y=21x2 .
The graph plotted for these points is represented below:
Note : The graphical transformations of the functions help us to easily plot graphs of complex and derived functions using the nature of the graphs of parent functions. Functions are plotted with the help of coordinates of the points lying on it.