Question
Question: How do you sketch the graph of \[y=0.5{{\left( x-2 \right)}^{2}}-2\] and describe the transformation...
How do you sketch the graph of y=0.5(x−2)2−2 and describe the transformation?
Solution
In order to find the solution of the given question that is to find how to sketch the graph of y=0.5(x−2)2−2 and describe the transformation, determine the form of the given equation with the help of the standard formula that is y=a(x−h)2+k then determine the turning point that is find (h,k) by comparing the given equation with the standard formula that is y=a(x−h)2+k. Now find the y-intercept by putting x=0, factorise the equation and solve for yand also find the x-intercept by putting y=0, factorise the equation and solve for x. After getting these points you’ll be able to sketch the graph and describe the transformation.
Complete step by step solution:
According to the question, given equation in the question is as follows:
y=0.5(x−2)2−2...(1)
As we can see the form of the above equation is parabola means it’s in the form of the standard formula that is y=a(x−h)2+k.
To determine the turning point that is find (h,k), compare the given equation with the standard formula, we get that
⇒h=2 and k=−2
With this we can interpret that the graph's turning point shifts 2 units to the right, and 2units down.
Therefore, the turning point is (2,−2).
The next step is to find the intercepts. Recall that to find the y-intercept by putting x=0, we get:
⇒y=0.5((0)−2)2−2
Now factorise the above equation and solve for y, we get:
⇒y=0.5(−2)2−2
⇒y=0.5×4−2
⇒y=2−2
⇒y=0
The y-intercept is at the origin, (0,0).
Now to find the x-intercept by put y=0 in equation (1), we get:
⇒0=0.5(x−2)2−2
To simplify it further factorise the above equation and solve for x, we get:
⇒0.5(x−2)2=2
⇒(x−2)2=0.52
⇒(x−2)2=4
⇒(x−2)2−4=0
⇒(x−2)2−22=0
Now to simplify it further apply the identity (a2−b2)=(a+b)(a−b) where a=(x−2) and b=2in the above equation, we get:
⇒((x−2)+2)((x−2)−2)=0
⇒x(x−4)=0
⇒x=0 and (x−4)=0
⇒x=0,4
Therefore, x-intercepts are (0,0)and (4,0).
Now as we have all the information, we can sketch the graph as shown in the figure below:
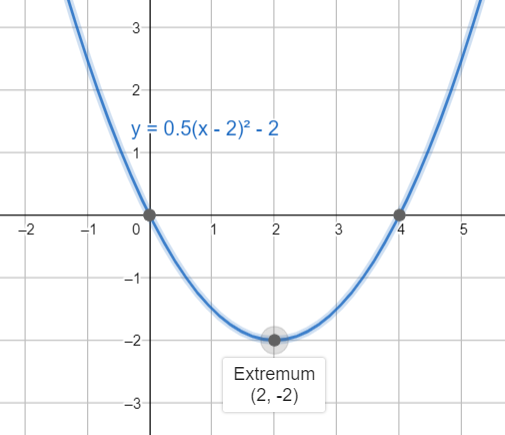
As you can see, the transformation in the above graph, that is the graph has shifted 2 units to the right and 2 units down compared to y=x2. The graph is also wider than y=x2. Since the value of a in the equation is 21.
Whereas the y-intercept is at the origin, (0,0)and the x-intercepts are (0,0)and (4,0).Also, The turning point is (2,−2).
Note: Students can go wrong while calculating the y-intercept and the x-intercepts. They make mistakes by letting x=0 to find the x-intercept and let y=0 to find the y-intercept which is completely wrong and further leads to the no answer. It’s important to remember to find the y-intercept, put x=0and solve for y. To find the x-intercept, put y=0 and solve for x.